
Futurum Buyer Data Show Momentum Eroding Across Most Enterprise Application Vendors, a Flat Platform Share of New Spending, and In-House AI Competing for the Same Budget
Analyst(s): Keith Kirkpatrick
Publication Date: October 19, 2026
Document #: AIOKK202610
What You Need to Know
- Stated Consolidation Has Not Reached Spending Plans: Buyers say they’re consolidating onto platforms, but their spending hasn’t followed that. In-house AI is now competing for the same budget as applications.
- The Squeeze Is Broad: Of 53 application products tracked in all three October TSIS surveys, 45 lost Net Score over two years, and 20 now carry a negative Net Score, up from 11. The Enterprise Apps sector Net Score fell from 16.4 to 9.6, against 47.8 for machine learning and artificial intelligence (ML/AI).
- Platform Suites and Long-Tail Vendors Lose Ground Differently: Both groups lost about six points of Net Score over two years – platform suites fell from 31.3 to 25, and long-tail vendors from 12.1 to 5.9. Platform suite customers mostly stay but are expanding less, with Replacing at 5.6% of citations. Long-tail vendors also lose customers outright, with Replacing up from 8.5% to 10.4%.
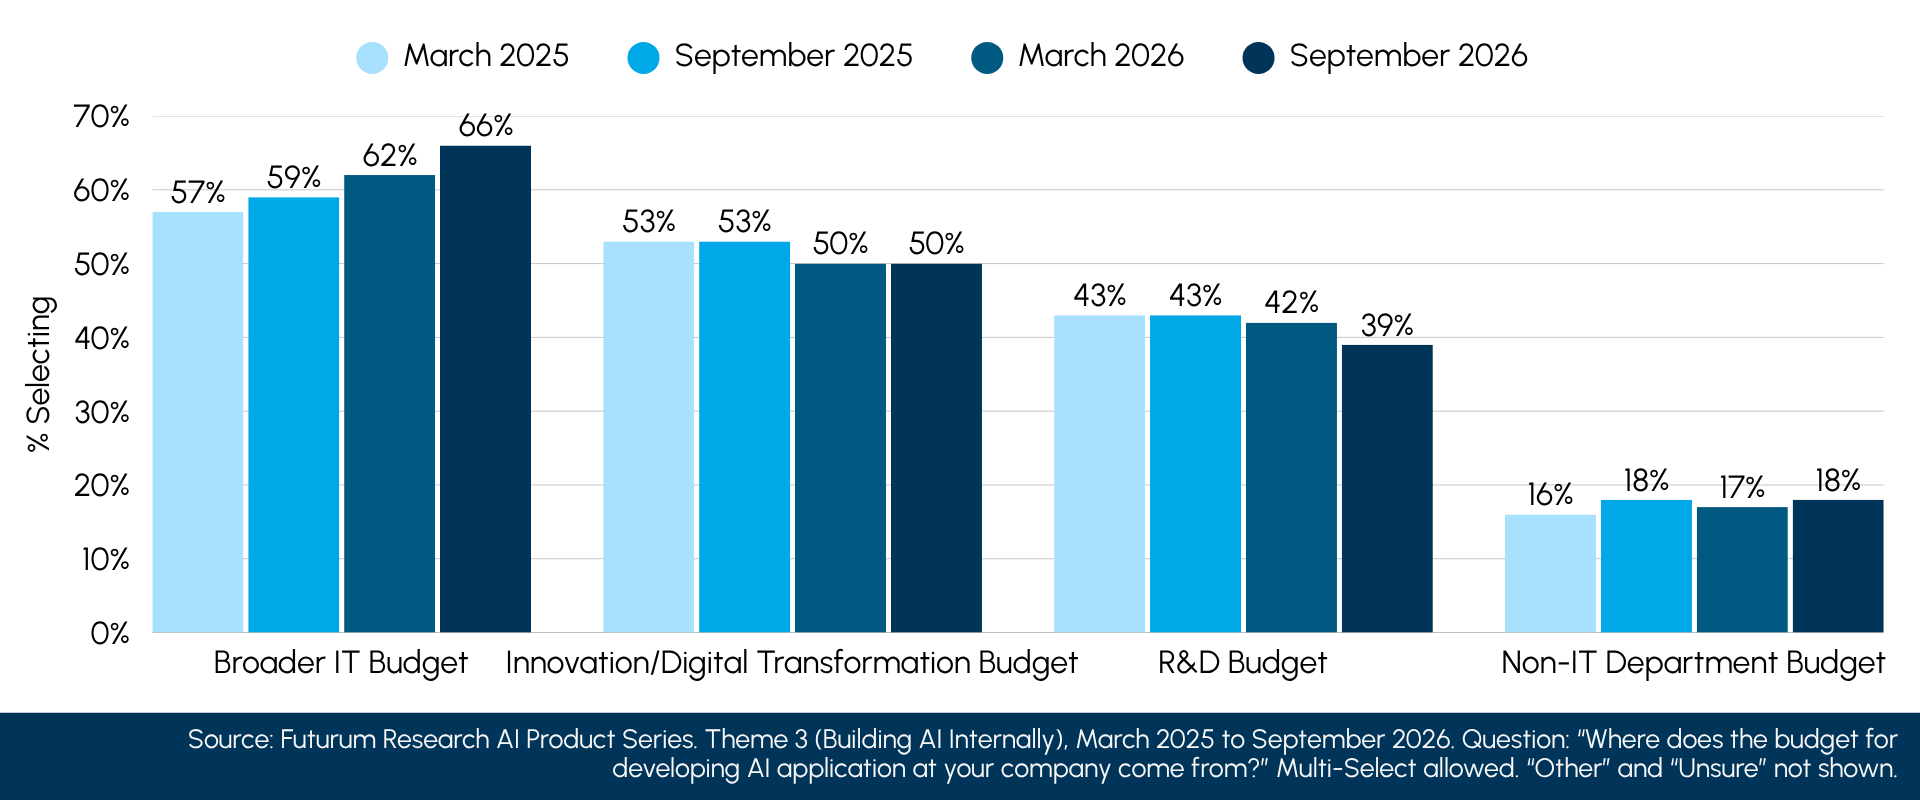
- Pricing is the Exposure: Buyers adopt platform suites for feature breadth (50%) and replace them over cost and return on investment (ROI) (58.4%). Meanwhile, 65.7% of organizations building their own AI applications fund that work from the broader IT budget that also pays for applications, up from 56.7% in March 2025.
The Futurum View
Software investors spent the first half of 2026 pricing in a “SaaSpocalypse,” the shorthand for AI agents displacing business applications; by late March, the iShares Expanded Tech-Software Sector ETF (IGV) was down 21% for the year. Buyer spending data tell a slower story. The Enterprise Apps sector Net Score in Futurum’s TSIS remains positive, and just over half (51.7%) of its October 2026 citations indicate flat spending. Momentum is eroding across most vendors, and the consolidation buyers describe in surveys has not yet moved their budgets toward platform suites.
That gap matters for every application vendor. Platform suites are holding customers but collecting less expansion from them, and long-tail vendors are losing customers without platform suites picking up the difference. Some of that money appears to be going to AI tools and in-house builds, which increasingly draw on the core IT budget. Futurum expects the collision between AI build budgets and application renewals to shape the next 12 to 18 months of enterprise software buying, and vendors that cannot show a return on each dollar of AI spending will feel it first.
Futurum’s channel research reads the same pressure from the partner side: among partners who sell enterprise applications, the share expecting them to drive growth fell 31.1 points to 25.9% in July 2026, last of 14 technology categories. Partner sentiment has fallen further than buyer spending intent, which remains positive.
App Spending Momentum Has Slid Steadily Since 2024
The Enterprise Apps sector Net Score, the share of citations from new adopters and those increasing spend minus the share from those decreasing or replacing, fell from 16.4 in October 2024 to 10.6 in October 2025 and 9.6 in October 2026 (n=1,262). Each October survey measures second-half (H2) plans against first-half (H1) actuals, so the comparison holds period for period. ML/AI moved from 57 to 47.8 over the same span.
Figure 1: Enterprise Apps vs. ML/AI Sector Net Score, January 2024 to October 2026
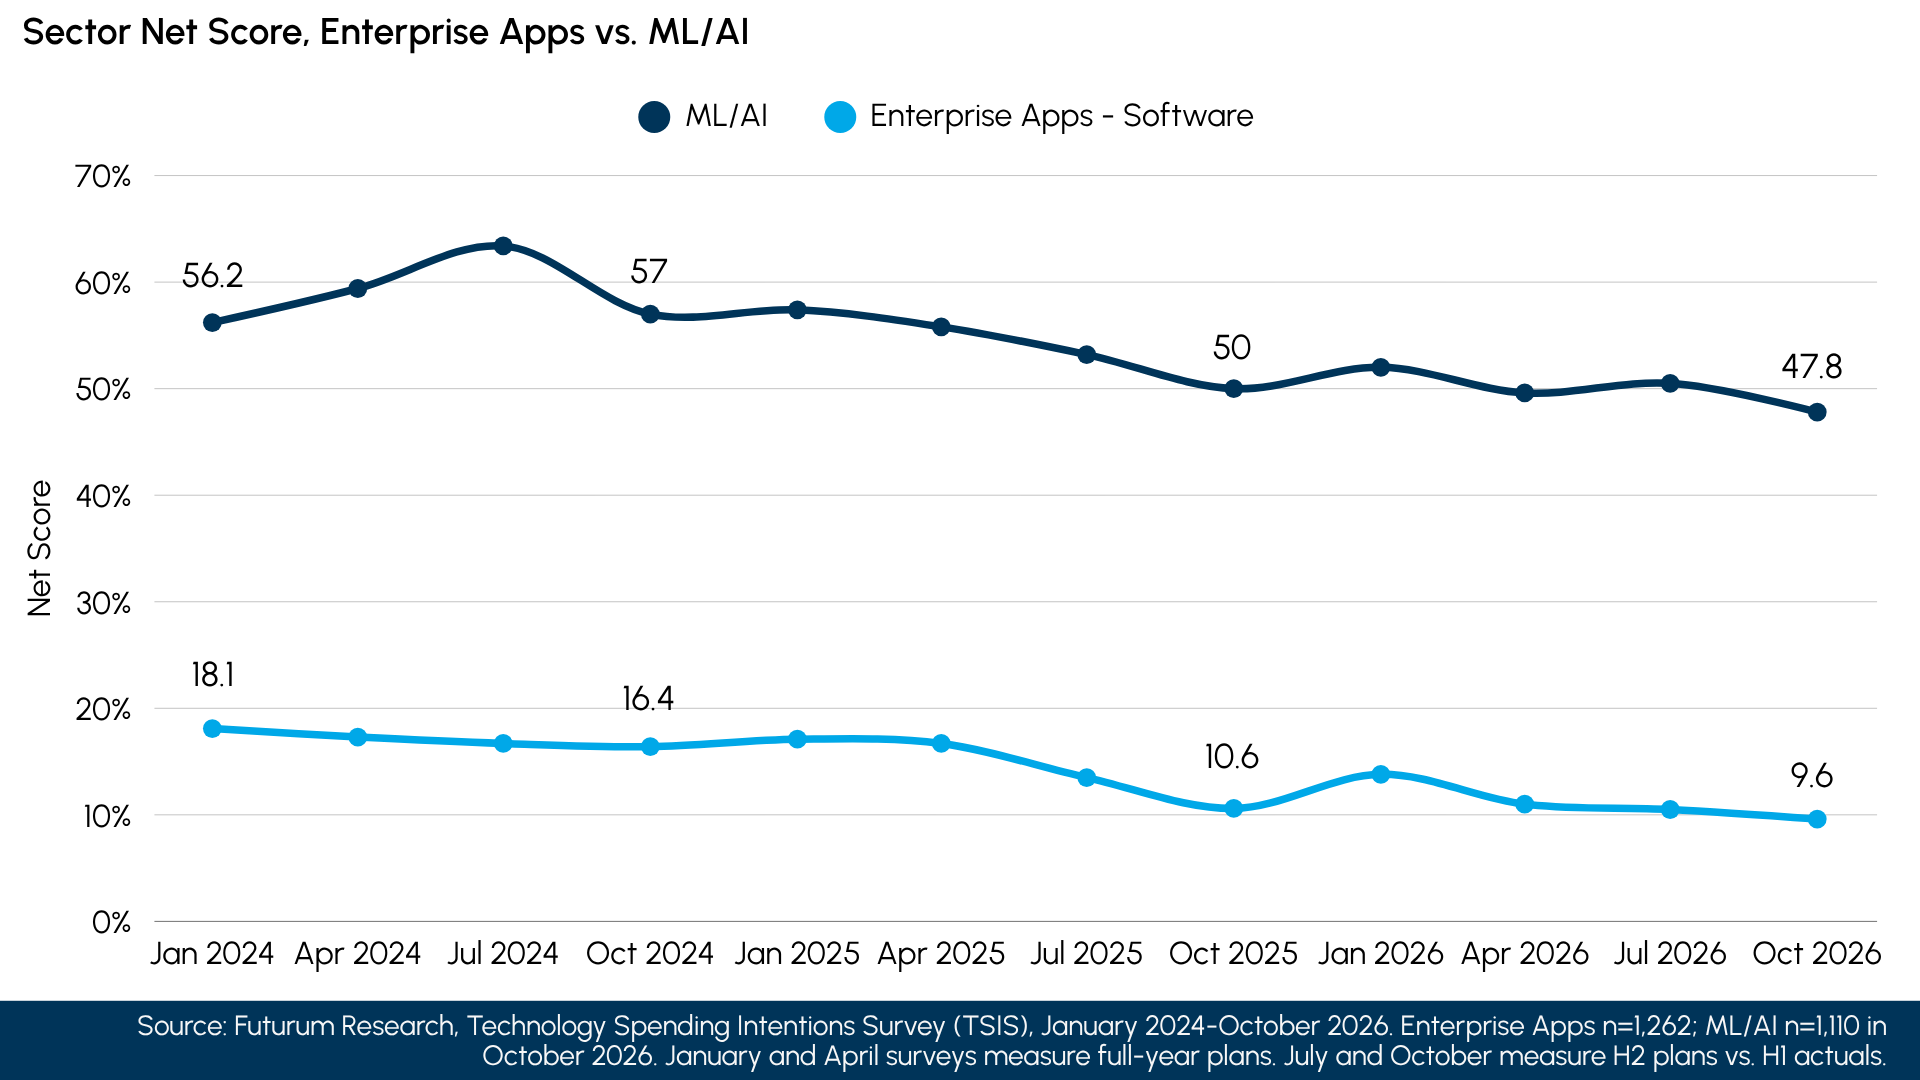
In October 2026, Replacing reached 9.3% of application citations, the highest of the 12 surveys since January 2024, when it was 7.6%. Adoption fell from 7.9% to 5.7% over the same period. Fewer new customers and more exits describe a mature category that buyers are re-underwriting contract by contract.
Platform Suites Hold a Flat Share of Expansion, While 45 of 53 Vendors Slow
To separate real movement from changes in the vendor roster, Futurum tracked the 53 Enterprise Apps products with at least 30 citations in each of the October 2024, 2025, and 2026 TSIS surveys.
- Breadth: On whole-number Net Scores, 45 of 53 products posted a lower Net Score in October 2026 than in October 2024; six rose and two were unchanged.
- Depth: The median product Net Score fell from 11.1 to 6.
- Below the Line: Products with a negative Net Score rose from 11 to 20, and 28 now show Replacing rates of 10% or higher, up from 24.
Figure 2: Median Vendor Net Score and Count of Net-Negative Vendors, Constant Panel of 53 Products
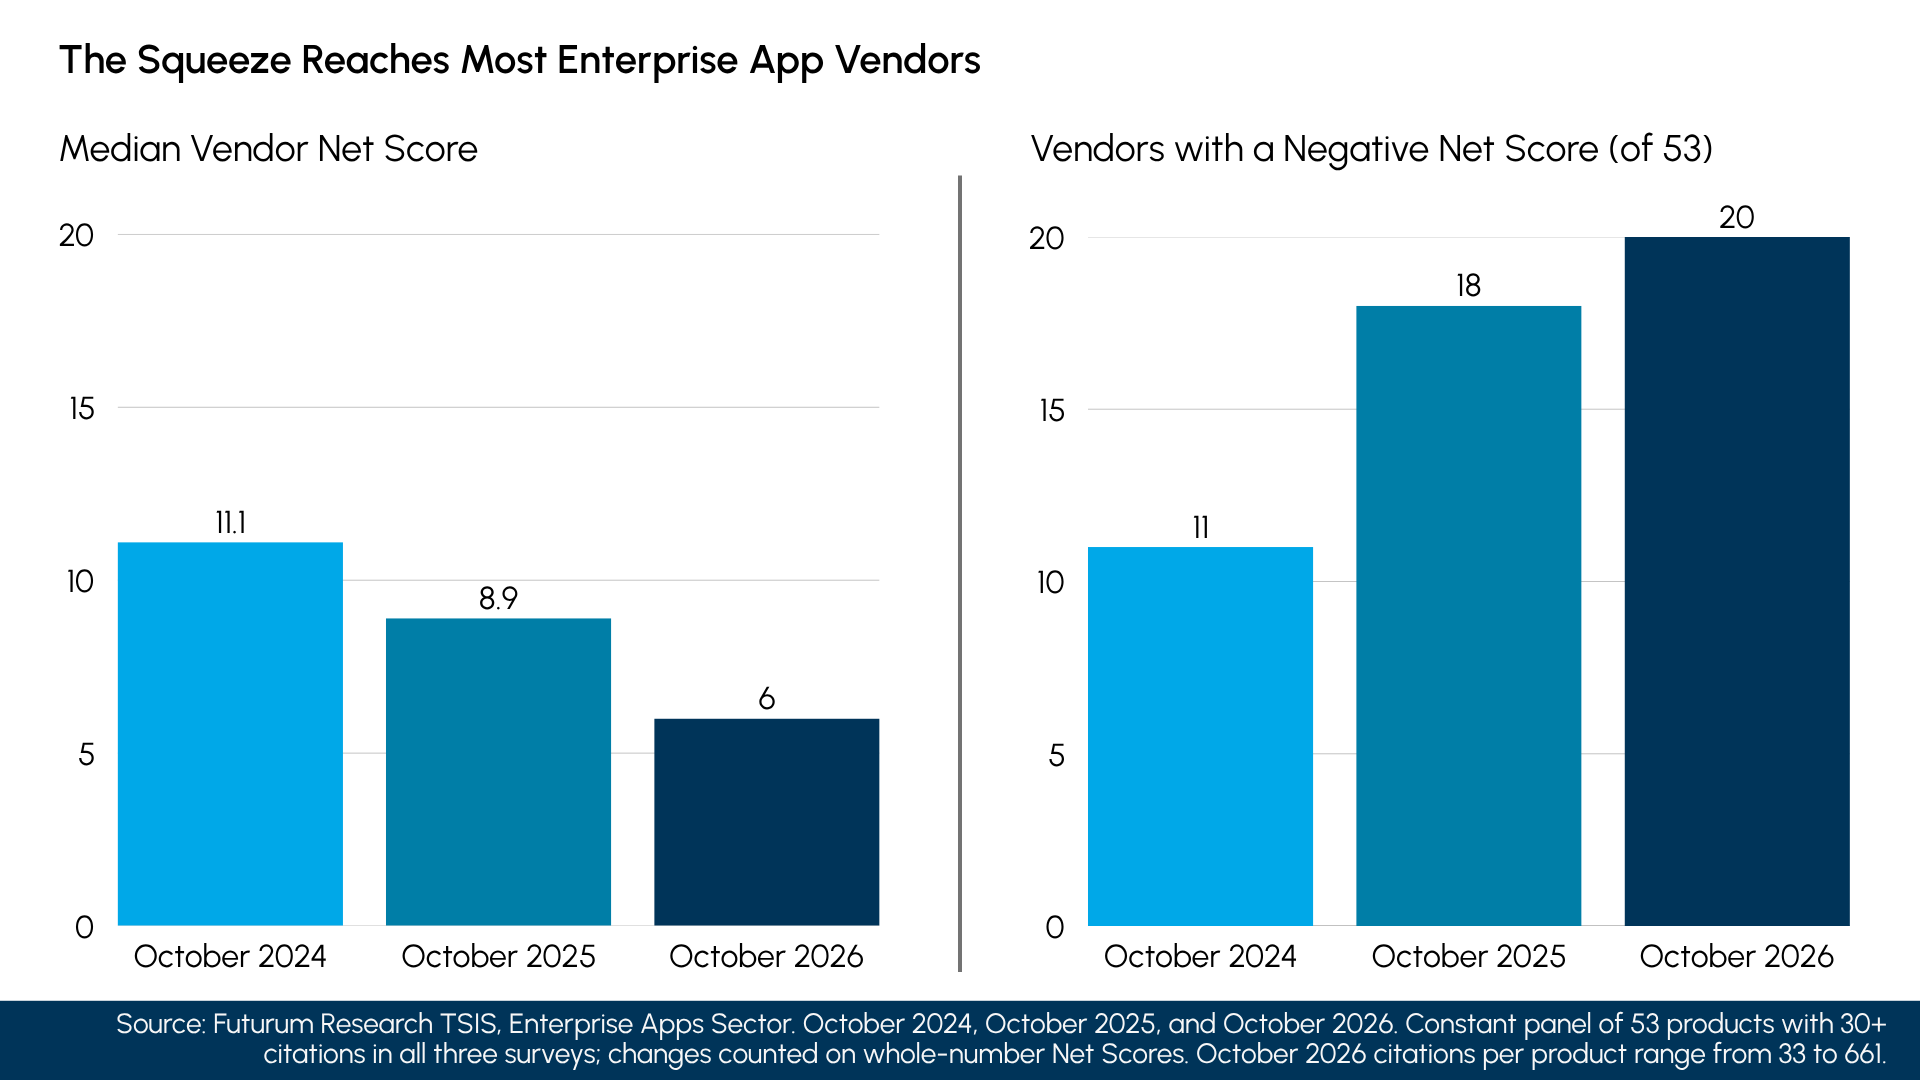
Size offers little protection. SAP S/4HANA’s Net Score fell from 46 to 31 (n=290), Microsoft Viva’s from 36 to 19 (n=331), and Microsoft Dynamics’ from 28 to 15 (n=473), while ServiceNow eased from 46 to 43 (n=601) and kept the highest score among Enterprise Apps products with 30 or more citations. Three of the six gainers are HR and payroll products: Paycom (Net Score up from −4 to 27, n=56), ADP (7 to 15, n=372), and Workday human capital management (HCM) (28 to 31, n=301). OneStream (10 to 25, n=57), Sprinklr (10 to 21, n=66), and TeamSupport also rose.
Consolidation Is Not Yet Visible in Expansion Plans
Futurum grouped the panel into 10 platform suites (ServiceNow, Salesforce, SAP S/4HANA, Workday HCM, Workday Financial Management, Microsoft Dynamics, Oracle Fusion, Zendesk, Freshworks, and Adobe) and 42 long-tail vendors, the other products in the panel. Most long-tail vendors are departmental and point applications, but the group also includes eight lines from SAP, Oracle, Microsoft, and Workday, such as Concur, Ariba, SuccessFactors, and NetSuite. Legacy SAP and Oracle on-premises lines are set aside. The TSIS tracks Adobe’s enterprise applications in its Marketing sector, so that line joins the platform cohort only.
Measured against all panel products except the legacy on-premises lines, platform suites accounted for 48.4% of all Adoption and Increase citations in October 2024, 49.3% in October 2025, and 48.6% in October 2026, on a stable base of about 39% of all citations. The original seven-suite cohort, without Zendesk, Freshworks, and Adobe, shows the same flat line at 40.3% to 41%. Meanwhile, the share of buyers describing a “mostly platform with point solutions” approach rose 5.9 points between Futurum’s 2H 2025 and 1H 2026 decision-maker surveys.1 Even consolidation does not favor platform suites by much. In the 2H 2026 survey, consolidators split almost evenly between replacing point tools with suites or platforms (47.3%) and with new point solutions (44.7%), and 7.9% were replacing applications with AI-native or vibe-coded apps (n=478). Buyers are planning consolidation faster than they are funding it.
Platform Customers Expand Less; Long-Tail Customers Also Leave
Both groups lost about six points of Net Score over two years: platform suites fell from 31.3 to 25, and long-tail vendors from 12.1 to 5.9. Platform suites lost momentum on expansion; long-tail vendors lost it on both Expansion and Replacing.
- Platform Suites: Replacing edged from 5.3% to 5.6%, and nearly all of that pressure comes from the two customer service suites: Zendesk’s Replacing rate rose from 10.3% to 14.2% (n=233), and Freshworks held at 12.5% (n=128). Excluding them, platform Replacing was 4.7%. Increase fell from 35% to 31.7% and Adoption from 7.5% to 6.1%. Customers are staying but adding less, a pattern consistent with Futurum’s 2H 2026 CIO survey, which found expected paid-seat growth in HR falling from 1.2% to 0.5% and in Finance from 1.5% to 1.0% between October 2025 and July 2026.
- Long-Tail Vendors: Increase slipped from 22.9% to 20%, and Replacing climbed from 8.5% to 10.4%. Removing the eight SAP, Oracle, Microsoft, and Workday lines sharpens the pattern: the remaining 34 products fell from a Net Score of 9 to 3.3, with Replacing rising from 9.9% to 11.6%.
Figure 3: Spending-Intent Mix, Platform Suites vs. Long-Tail Vendors, October 2024 and October 2026
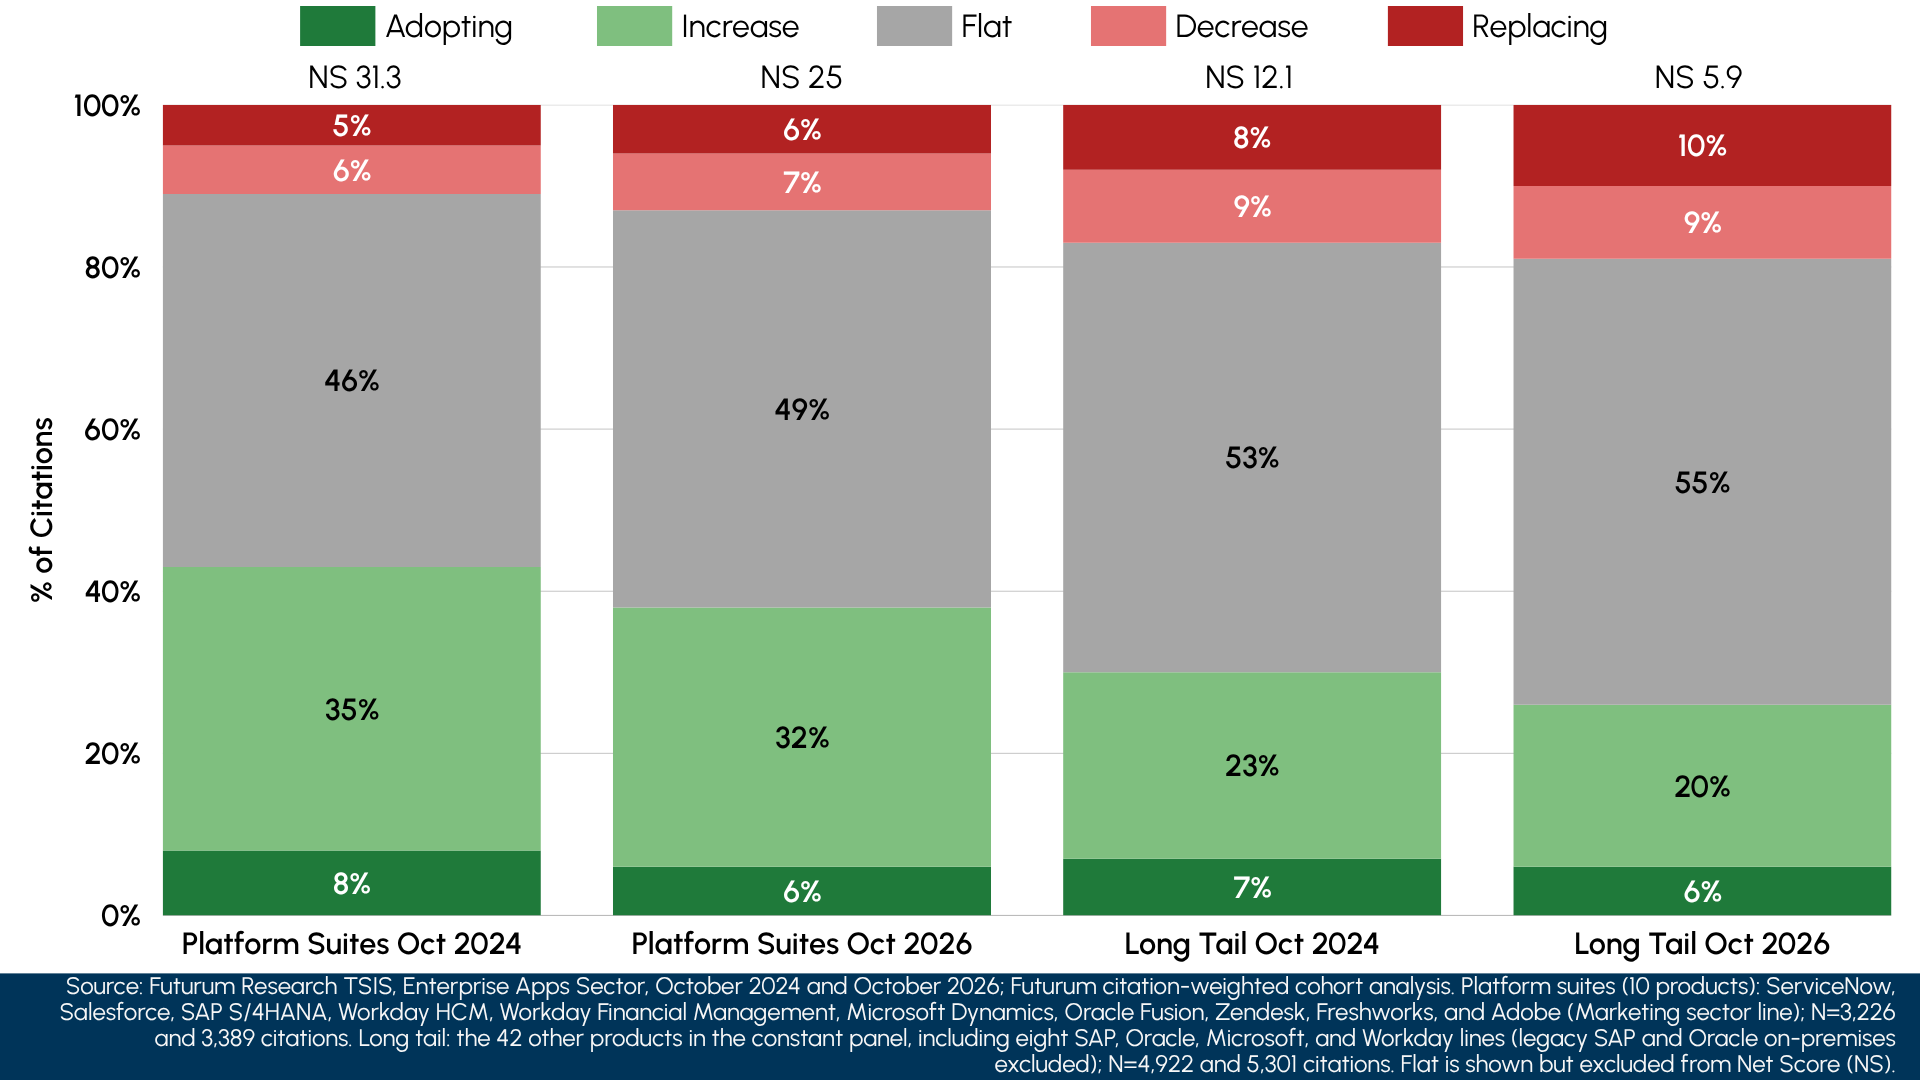
Rising long-tail Replacing has not shown up as extra platform expansion, so some of the money leaving long-tail vendors may be flowing outside the application category. Futurum Intelligence buyer commentary from the same period shows both destinations. One ServiceNow customer increasing spend described consolidation in progress: “Some of the increased ServiceNow spend is offset by reduced reliance on Jira, as we consolidate workflows and service management capabilities onto ServiceNow.” An organization increasing its OpenAI spend is moving money out of the category:
“We are reducing spend on many traditional tools that help with ideation [and] workflow automation. And more niche products like SurveyMonkey are not going to really be needed.”
Buyers Choose Platform Suites for Breadth and Leave Them Over Cost
Among 146 respondents adopting a platform suite in Futurum’s October 2026 TSIS, 50% cited feature breadth, 46.6% technical capabilities, and 39.7% stack alignment, with cost and ROI fourth at 39%. Among 137 replacing one, 58.4% cited cost and ROI, and 14.6% cited feature breadth.
Figure 4: Most-Cited Reasons for Adopting and Replacing Enterprise Apps, October 2026
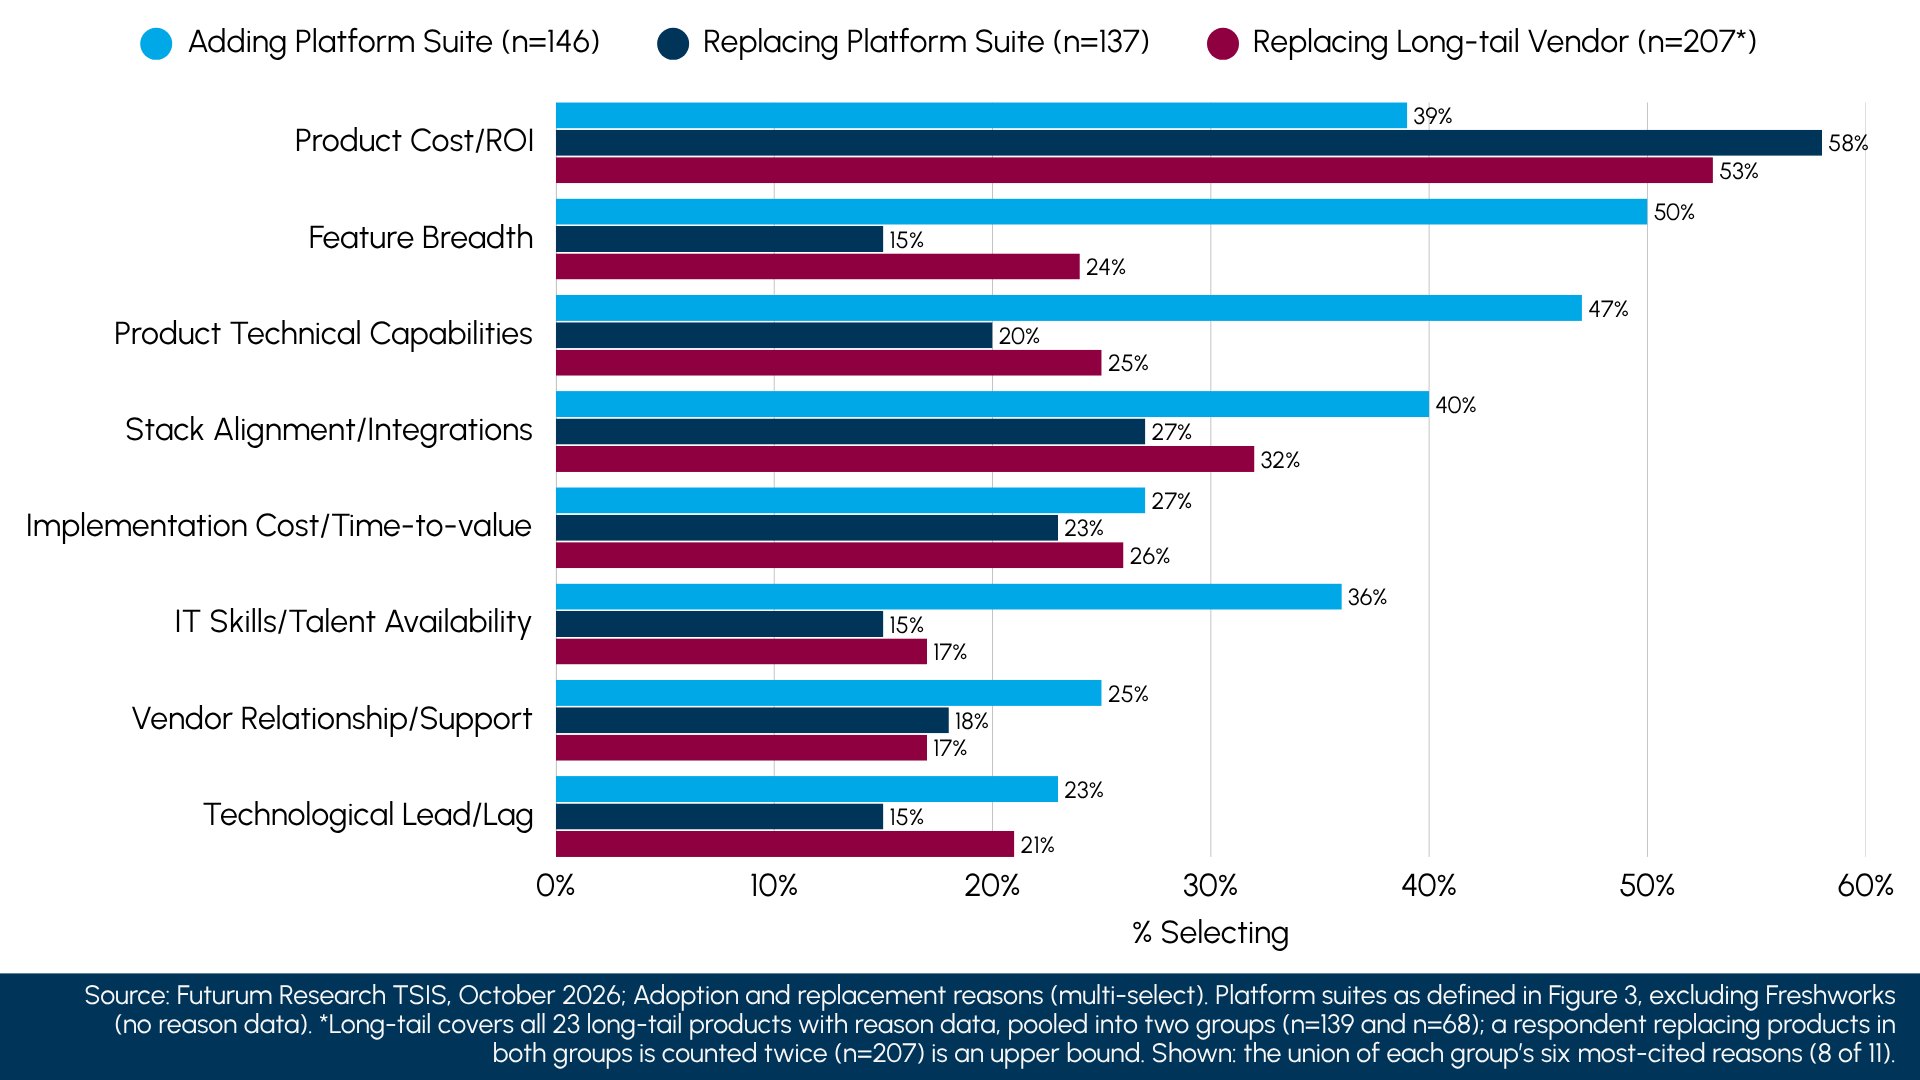
Exits from long-tail vendors are also driven mainly by cost. Pooling all 23 long-tail products with reason data, about 53% of replacing respondents cited cost and ROI, followed by stack alignment (about 32%), implementation cost (26%), technical capabilities (25%), and feature breadth (24%). Feature breadth still matters noticeably more in long-tail exits than in platform exits, consistent with buyers trading point tools for broader products.
The main exposure for platform suites is price, arriving as several of them shift from seat fees toward metered and agent-based models, such as Salesforce’s and Workday’s flexible credit offerings, which the vendors position as a way to align spending with the value customers receive. Futurum Intelligence buyer commentary on Salesforce Agentforce from July 2026 is mixed. Many respondents plan to increase spend, and one reported, “We’re seeing tons of ROI so the plan is to invest in this long term.” Others are cutting back. One reported, “We just aren’t seeing the ROI we’d like to on the product,” and another, moving agentic workflows to Camunda, cited a “complete lack of ROI on Agentforce deployments.” Some customers are also weighing in-house builds against renewals. A Workday customer planning to cut spend wrote:
“Move to AI-based apps based on Anthropic models instead of using Workday, as Workday licensing [is] very expensive.”
AI-Build Budgets Are Moving into the Pool That Funds Applications
In a May 14, 2026 data note, Futurum Intelligence reported that the share of organizations funding in-house AI development from the broader IT budget rose from 56.7% in the March 2025 AI Product Series survey to 61.7% in March 2026. The September 2026 survey extends that run to 65.7% (N=600 per survey). Over the same period, innovation and digital transformation budgets slipped from 52.7% to 49.5% as a funding source, and R&D budgets from 42.8% to 38.8%. Business units remain a second source: in Futurum’s 2H 2026 CIO survey, 23.1% of organizations whose AI spending exceeded plan reallocated budget from business units outside IT (N=767).
Figure 5: Funding Sources for In-House AI Application Development, March 2025 to September 2026
Among those same organizations building their own AI applications, the internal builds already overlap with application categories. In September 2026, employee support (46%) and enterprise search or knowledge management (41.5%) were the most common in-house AI applications in production, followed by data analytics and operations (40%), cost reduction (38%), and customer engagement or chatbots (37.8%), functions served today by IT and HR service management, knowledge, and customer experience software.
Most AI spending is still additive. Futurum’s coding of buyer commentary on OpenAI and Anthropic found that 68% of organizations increasing spend with those vendors described it as net-new or incremental budget. Buyers expect the offset to come next. One organization increasing its OpenAI spend in September 2026 put it this way:
“No, not yet, this is still coming out of the general IT budget. As we start to see efficiencies, we may begin cutting on areas where AI can be more useful, like business analysis.”
Some organizations have already started cutting software to pay for AI. In Futurum’s 2H 2026 CIO survey, 36.4% of organizations that reallocated funds within IT to cover AI overruns cut non-AI software licenses (N=297).7 With overall 2026 IT budgets expected to grow 3.84% (N=1,636), budgets for building AI in-house and application renewals now draw on the same slow-growing pool.
Vendors Need Pricing That Keeps AI Spending Inside the Contract
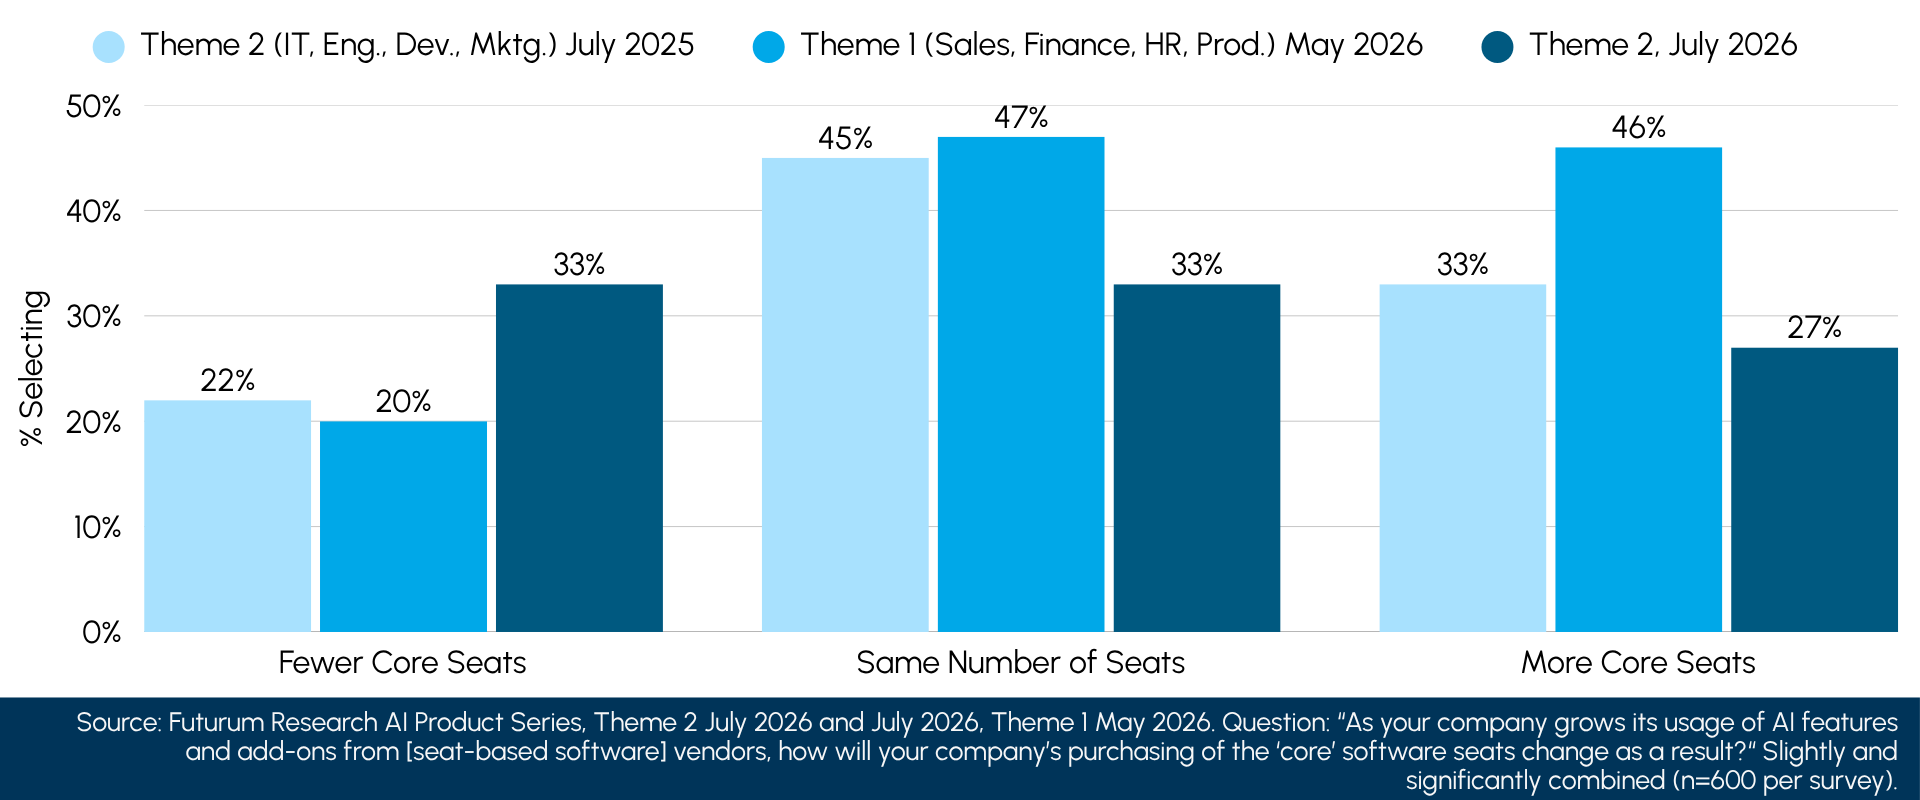
Seat counts are becoming a weaker basis for application revenue. In Futurum’s AI Product Series, 27.5% of respondents covering IT, engineering, developer, and marketing software in July 2026 expected to buy fewer core software seats as their use of vendors’ AI features grows, against 26.8% expecting to buy more. It is the first time “fewer” has led in that survey series; a year earlier, the split was 22.3% fewer to 32.8% more (N=600). Respondents covering sales, finance, and HR software remained net positive in May 2026, at 20.5% fewer and 32.7% more.
Figure 6: Expected Change in Core Software Seat Purchases as AI Use Grows
- Capture AI Spending Inside the Existing Contract: Buyers are split on how to pay for AI. In Futurum’s 2H 2026 Enterprise Applications Decision Maker Survey, per-user pricing was the single most preferred model for add-on AI (42.3%, n=645), but consumption (36.6%) and outcome-based pricing (21.1%) together reached 57.7%. Vendors can keep a predictable, seat-like price, but the revenue base beneath it needs to include agent usage, through a pooled allowance shared by human users and agents, so a smaller seat count shifts spend into usage within the same contract. Pure per-seat revenue hands every AI efficiency gain to the renewal negotiation.
- Include Baseline AI in the Workflows Customers Build Themselves: Employee support and enterprise search are the most common in-house AI applications in production, and customer engagement is close behind. Bundling baseline AI for these workflows into the core subscription means a do-it-yourself build has to beat a capability the customer already owns.
- For Long-Tail Vendors, Ship as a Component of the Platform Suite: Long-tail exits cite feature breadth far more often than platform exits do (24% against 14.6%) and stack alignment somewhat more often (32% against 27%). Shipping as native components and agents inside the larger platform suites’ marketplaces addresses those reasons directly, priced so the platform buyer can add them without a separate procurement cycle.
What to Watch:
- Platform Share of Expansion: The consolidation gap closes if platform suites’ share of Adoption and Increase citations moves two points above its 2024 to 2026 range (above about 51% for 10 suites, or 43% for the seven-suite cohort) and holds for two consecutive TSIS surveys. The January 2027 survey of full-year plans is the first read.
- Long-Tail Replacing: Replacing among long-tail vendors has risen about two points in two years to 10.4%. A further rise in January 2027 full-year plans would mark an acceleration.
- Seat Offset in Sales, Finance, and HR: The November 2026 AI Product Series read on sales, finance, and HR software will show whether the seat pessimism visible among IT and engineering buyers reaches the core application buyer.
- 2027 Budget Allocation: Futurum Intelligence’s preliminary first read of 2027 IT budgets opens at +5%. Whether application lines share that growth or fund AI builds will show up in the January 2027 TSIS.
Methodology
Futurum Intelligence’s Technology Spending Intentions Survey (TSIS) asks IT decision-makers how their spending on each vendor will change. The October 2026 survey compares planned H2 2026 spending with H1 actuals. Net Score equals the share of citations from new adopters and those increasing spend, minus the share decreasing or replacing; Flat spending is excluded.
Vendor-level analysis uses the 53 Enterprise Apps products with at least 30 citations in each of the October 2024, 2025, and 2026 surveys; changes are counted on whole-number Net Scores. The platform cohort adds Adobe’s Marketing-sector line (n=345 in October 2026).
Platform share of expansion is measured against all panel products except the legacy SAP and Oracle on-premises lines, plus Adobe; the cohort findings hold whether the eight SAP, Oracle, Microsoft, and Workday lines sit in the long-tail group or are removed. Cohort figures are citation-weighted by Futurum. Reason-for-change data allow multiple selections; Freshworks lacks reason data and is absent from Figure 4, and the long-tail reasons combine two pooled groups, so a respondent replacing products in both may be counted twice. AI Product Series data come from the Theme 3 (Building AI internally) survey and, for seat offset, from Theme 1 (Sales, Finance, HR, and Productivity) and Theme 2 (IT, Engineering, Developer, and Marketing); N=600 per wave.
Stated procurement strategy and consolidation plans come from Futurum’s 1H 2026 Enterprise Software Decision Maker Survey (fielded January 2026) and 2H 2026 Enterprise Applications Decision Maker Survey (fielded through July 3, 2026), which measure a different respondent pool from the TSIS. Futurum Intelligence buyer commentary also comes from separate respondent pools; quotes illustrate themes and do not explain TSIS movements.
Disclosure: Futurum is a research and advisory firm that engages or has engaged in research, analysis, and advisory services with many technology companies, including those mentioned in this article. The author does not hold any equity positions with any company mentioned in this article.
Analysis and opinions expressed herein are specific to the analyst individually and data and other information that might have been provided for validation, not those of Futurum as a whole.
Other Insights From Futurum:
Salesforce’s Real Moat Behind Koa Is Its CRM Training Data
The Pricing Split: Why Core Software and AI Can’t Share One Commercial Model
Agentic AI’s Real Test Is Process Redesign
Author Information

Keith Kirkpatrick is VP & Research Director, Enterprise Software & Digital Workflows for The Futurum Group. Keith has over 25 years of experience in research, marketing, and consulting-based fields.
He has authored in-depth reports and market forecast studies covering artificial intelligence, biometrics, data analytics, robotics, high performance computing, and quantum computing, with a specific focus on the use of these technologies within large enterprise organizations and SMBs. He has also established strong working relationships with the international technology vendor community and is a frequent speaker at industry conferences and events.
In his career as a financial and technology journalist he has written for national and trade publications, including BusinessWeek, CNBC.com, Investment Dealers’ Digest, The Red Herring, The Communications of the ACM, and Mobile Computing & Communications, among others.
He is a member of the Association of Independent Information Professionals (AIIP).
Keith holds dual Bachelor of Arts degrees in Magazine Journalism and Sociology from Syracuse University.