
Disclosure: This report was commissioned by Freshworks and conducted independently by The Futurum Group.
Freshservice, by Freshworks, is a cloud-native service management platform that helps unify service, asset, and operations management on one AI-powered platform. The suite includes incident and change management, asset management,Configuration Management Database (CMDB), self-service portals, modern incident management, AI-powered automation through Freddy AI, and real-time analytics. The platform is built for enterprise scale and extends beyond IT to HR, finance, facilities, and any service-intensive function.
Futurum measured the Business Economic Value (BEV) of Freshservice by interviewing leaders from four enterprise customers, each with 800 to 1,200 licensed agents using Freshservice, and aggregating their reported business impacts with proprietary Futurum Research data and 91 customer reviews from global enterprise customers of Freshservice on G2. Futurum built a scalable composite financial model per 100 users that quantifies the investment and measurable benefits across interviewees’ deployments, demonstrating the potential financial impact for Freshservice customers.
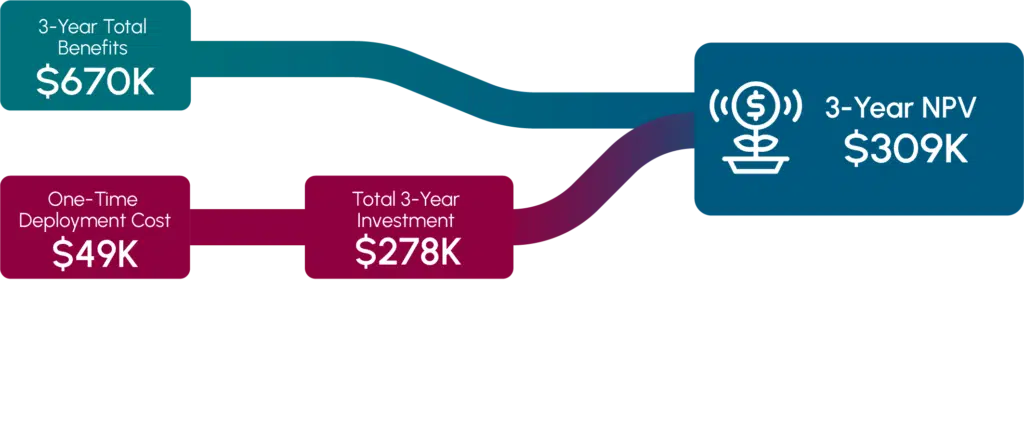
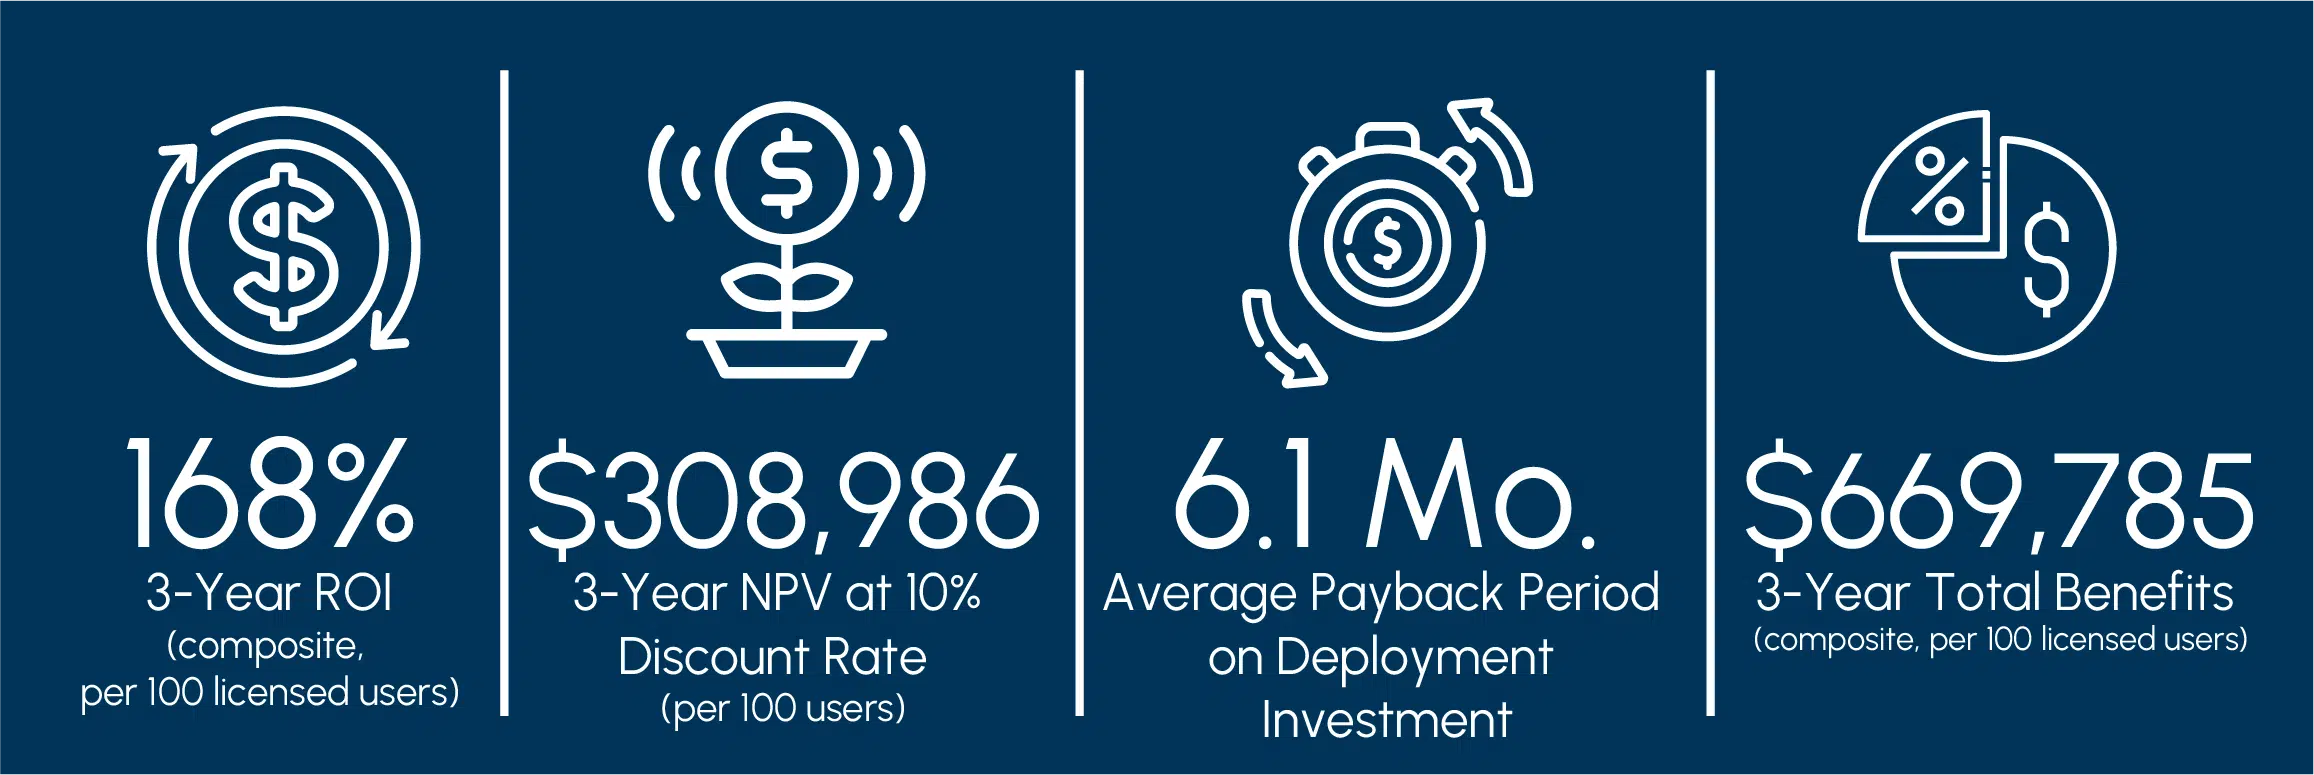
Futurum’s financial analysis found that Freshservice delivered a three-year ROI of 168% and a 6.1-month payback period for enterprise customers that replaced high-cost legacy platforms with Freshservice’s unified, AI-enabled ITSM environment (see Figure 1). Accounting for both benefits and costs, the deployment generated a three-year Net Present Value (NPV) of $308,986 per 100 licensed users, meaning each licensed user generated over $1,000 of net benefits after costs per year.
All four organizations achieved consistent, measurable financial benefits by deploying Freshservice despite differences in scale, industry, and prior platform complexity. The top three financial returns from migrating from large legacy platforms to Freshservice included:
Freshservice also enhanced service delivery, enabled AI capability maturity, improved compliance and reduced risks, shifted teams to higher-value work, and improved employee experience. Interviewees were satisfied with their investment, and this sentiment is echoed by G2 review data, which shows an NPS score of 75 with a 4.5/5 rating across 91 enterprise reviewers of Freshservice in the past three years.¹
When nearly three-quarters of enterprise buyers say UI matters most, the complexity burden of legacy ITSM platforms becomes a measurable economic liability, not just an annoyance.
1 Source: G2 review data from April 27, 2023 through April 27, 2026 from global enterprise customers of Freshservice (N=91 reviewers).
Futurum, a leading technology research and analyst firm, conducted in-depth interviews in early 2026 with four enterprise organizations that actively use Freshservice as their primary IT service management platform. These organizations were selected based on demonstrated use across IT and business service workflows and their ability to provide both cost and operational impact data; they are presented anonymously with aggregated individual data points to protect confidentiality. Futurum consolidated data from the four organizations, along with its proprietary research data and G2 buyer and user data, into a composite financial model that represents a typical Freshservice enterprise deployment. Where organizations differed in scale, pricing structure, or deployment approach, Futurum normalized inputs to a common baseline to enable comparability across the dataset (see Table 1).
This research was commissioned by Freshworks. Futurum conducted all data collection, modeling, and analysis independently and retains final editorial control over the findings and content.
Table 1. Profile of Participating Organizations Included in the Composite Model
| Organization Type | Industry | Employees | Agents |
|---|
Source: Futurum Group
The BEV analysis evaluates impact over a three-year period, consistent with typical enterprise investment horizons. Futurum applied fully burdened, organization-specific labor rates ranging from $45 to $92 per hour, reflecting regional variation in IT staffing costs confirmed by interviewees. Futurum applied 50-65% attribution factor to productivity and operational benefits to isolate the impact of Freshservice relative to other contributing systems and process changes. This conservative assumption reflects that not all observed benefits can be attributed solely to the platform. Direct cost savings, such as reductions in legacy platform licenses, are attributed 100% to measured cost differences. Pre-Freshservice baseline rates were modeled to reflect phased deployment and AI capability expansion across user groups, based on patterns observed in the four interviewed organizations.
The composite model focuses on measurable financial and operational outcomes. The analysis does not assume workforce reductions unless interview participants explicitly state otherwise; productivity gains appear as increased service capacity and throughput rather than headcount reductions. Results are based on a limited sample of four organizations and do not represent the full population of Freshservice customers. However, the findings provide a directional view of observed outcomes and consistent value patterns across active production deployments (see Table 2).
Table 2. Key Financial Assumptions and Modeling Parameters
| Financial Assumption | Value / Approach |
|---|
Source: Futurum Research
Before deploying Freshservice, the four organizations in this study faced a common problem that manifested differently across their industries: ITSM environments had become too expensive, too fragmented, or too brittle to support their next phases of growth.
Futurum’s data agrees: according to CIOs, Vendor Management has risen from a major challenge for 15.3% of CIOs up to 27.8% of CIOs from Q2 to Q4 of 2025 alone. A strong platform consolidation strategy is an important way to control vendor management challenges.²
Freshservice addressed these structural gaps by replacing fragmented, overpriced environments with a unified, AI-enabled platform built for modern service operations, rather than adding another layer of tooling.
2 Futurum Research, CIO Insights Global Survey, Q2 2025 and Q4 2025. Filtered to enterprise respondents.
Each organization’s leaders and IT decision-makers decided to migrate from their large legacy platforms to Freshservice with convergent selection criteria:
Across organizations, the common draw was Freshservice’s all-inclusive licensing model: a single per-seat price that covers AI, analytics, CMDB, change management, and the full ITSM module suite. Organizations that had been paying incremental add-on fees for each capability found this model both structurally simpler and financially more predictable. As one interviewee noted, platforms that price capabilities individually limit adoption. Departments that could benefit from AI or analytics self-service are often excluded because the incremental cost of enabling access is too high.
Meanwhile, AI spending is steeply rising. According to Futurum’s 1H2026 data, the top three GenAI use cases for AI Platform decision-makers are Support/CX (56.5%), Knowledge Management (51.7%), and Operations/Workflow (51.1%), which each map directly to ITSM core functions.3 An ITSM platform like Freshservice, which delivers embedded AI for ticket resolution, knowledge base automation, and workflow orchestration, is positioned at the intersection of the three highest-priority enterprise AI use cases. AI Platform decision-makers also identify transparent pricing, rapid implementation, fast time to value, and strong data governance as critical factors – areas where interviewees felt Freshservice excelled.4
Futurum’s review of G2 data from the past three years identified 91 reviews from global enterprise customers of Freshservice.5 For these reviewers, the top two drivers by far were ease of use and features. They rated Freshservice: 6.4/7 for meeting requirements, 6.5/7 for ease of use, 6.25/7 for ease of setup, and 6.44/7 for ease of admin. Reviewers reported a 5/7 sentiment to pricing, but when compared specifically to the large enterprise platforms, cost savings and consolidation emerged as major categories:
3 Futurum Research, AI Platforms Decision Maker Survey, 1H 2026.
4 Futurum Research, AI Platforms Decision Maker Survey, 1H 2026.
5 Source: G2 review data from April 27, 2023 through April 27, 2026 from global enterprise customers of Freshservice (N=91 reviewers).
“The main issue for us was the pricing – [prior solution] was planning to nearly triple our annual costs. In comparison, Freshservice has proven to be a much better fit for our needs.”
“We switched from [prior solution] to Freshservice primarily for ease of use, better value, and faster implementation. Freshservice offers a much more intuitive interface, both for agents and end users, which reduced training time and improved adoption across the board. While [prior solution] is highly customizable, it often felt overly complex and required significant effort to manage and configure. Freshservice strikes a better balance – it’s powerful, but far more user-friendly and agile for our team’s daily needs.”–Administrator review of Freshworks on G2, a global enterprise that switched from a large legacy platform
"Our prior platform is a powerful tool that met the company's needs at too high a price point. The number one decision maker was cost."
– IT Operations Coordinator, Specialty Retail
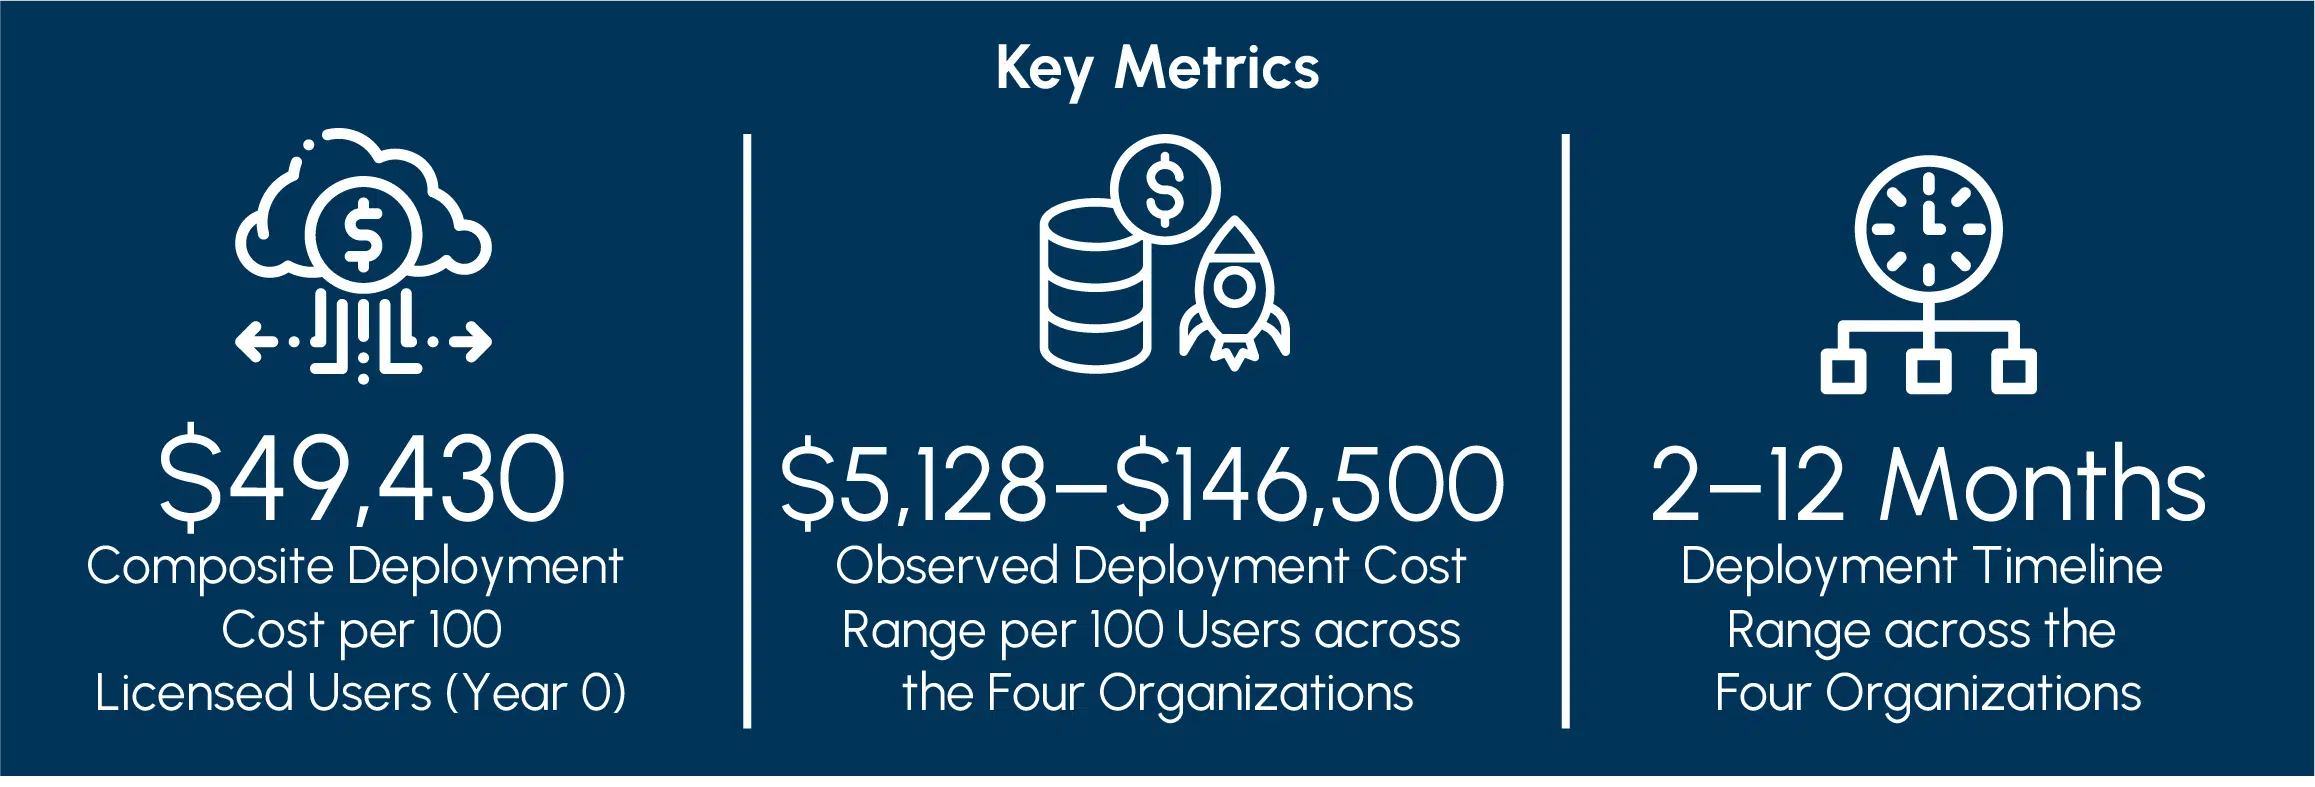
Deployment timelines to migrate from legacy platforms to Freshservice ranged from two months to one year for the participating enterprises, with variance driven by scale and the balance between a tight scope for speed versus more careful deployments for high-complexity needs or future-proofing.
Agent onboarding proved less burdensome than expected for all four interviewees. Although training and change management are often cited as major deployment cost drivers for similar investments, interviewees consistently described these deployments as straightforward, thanks to Freshservice’s user-friendly interface and onboarding materials.
None of the organizations added a net headcount to support the deployment. Once the first production workflows were live and agents could see tickets routing, resolving, and escalating automatically without manual intervention, the internal conversation shifted from ‘should we expand this?’ to ‘what else can we automate?’
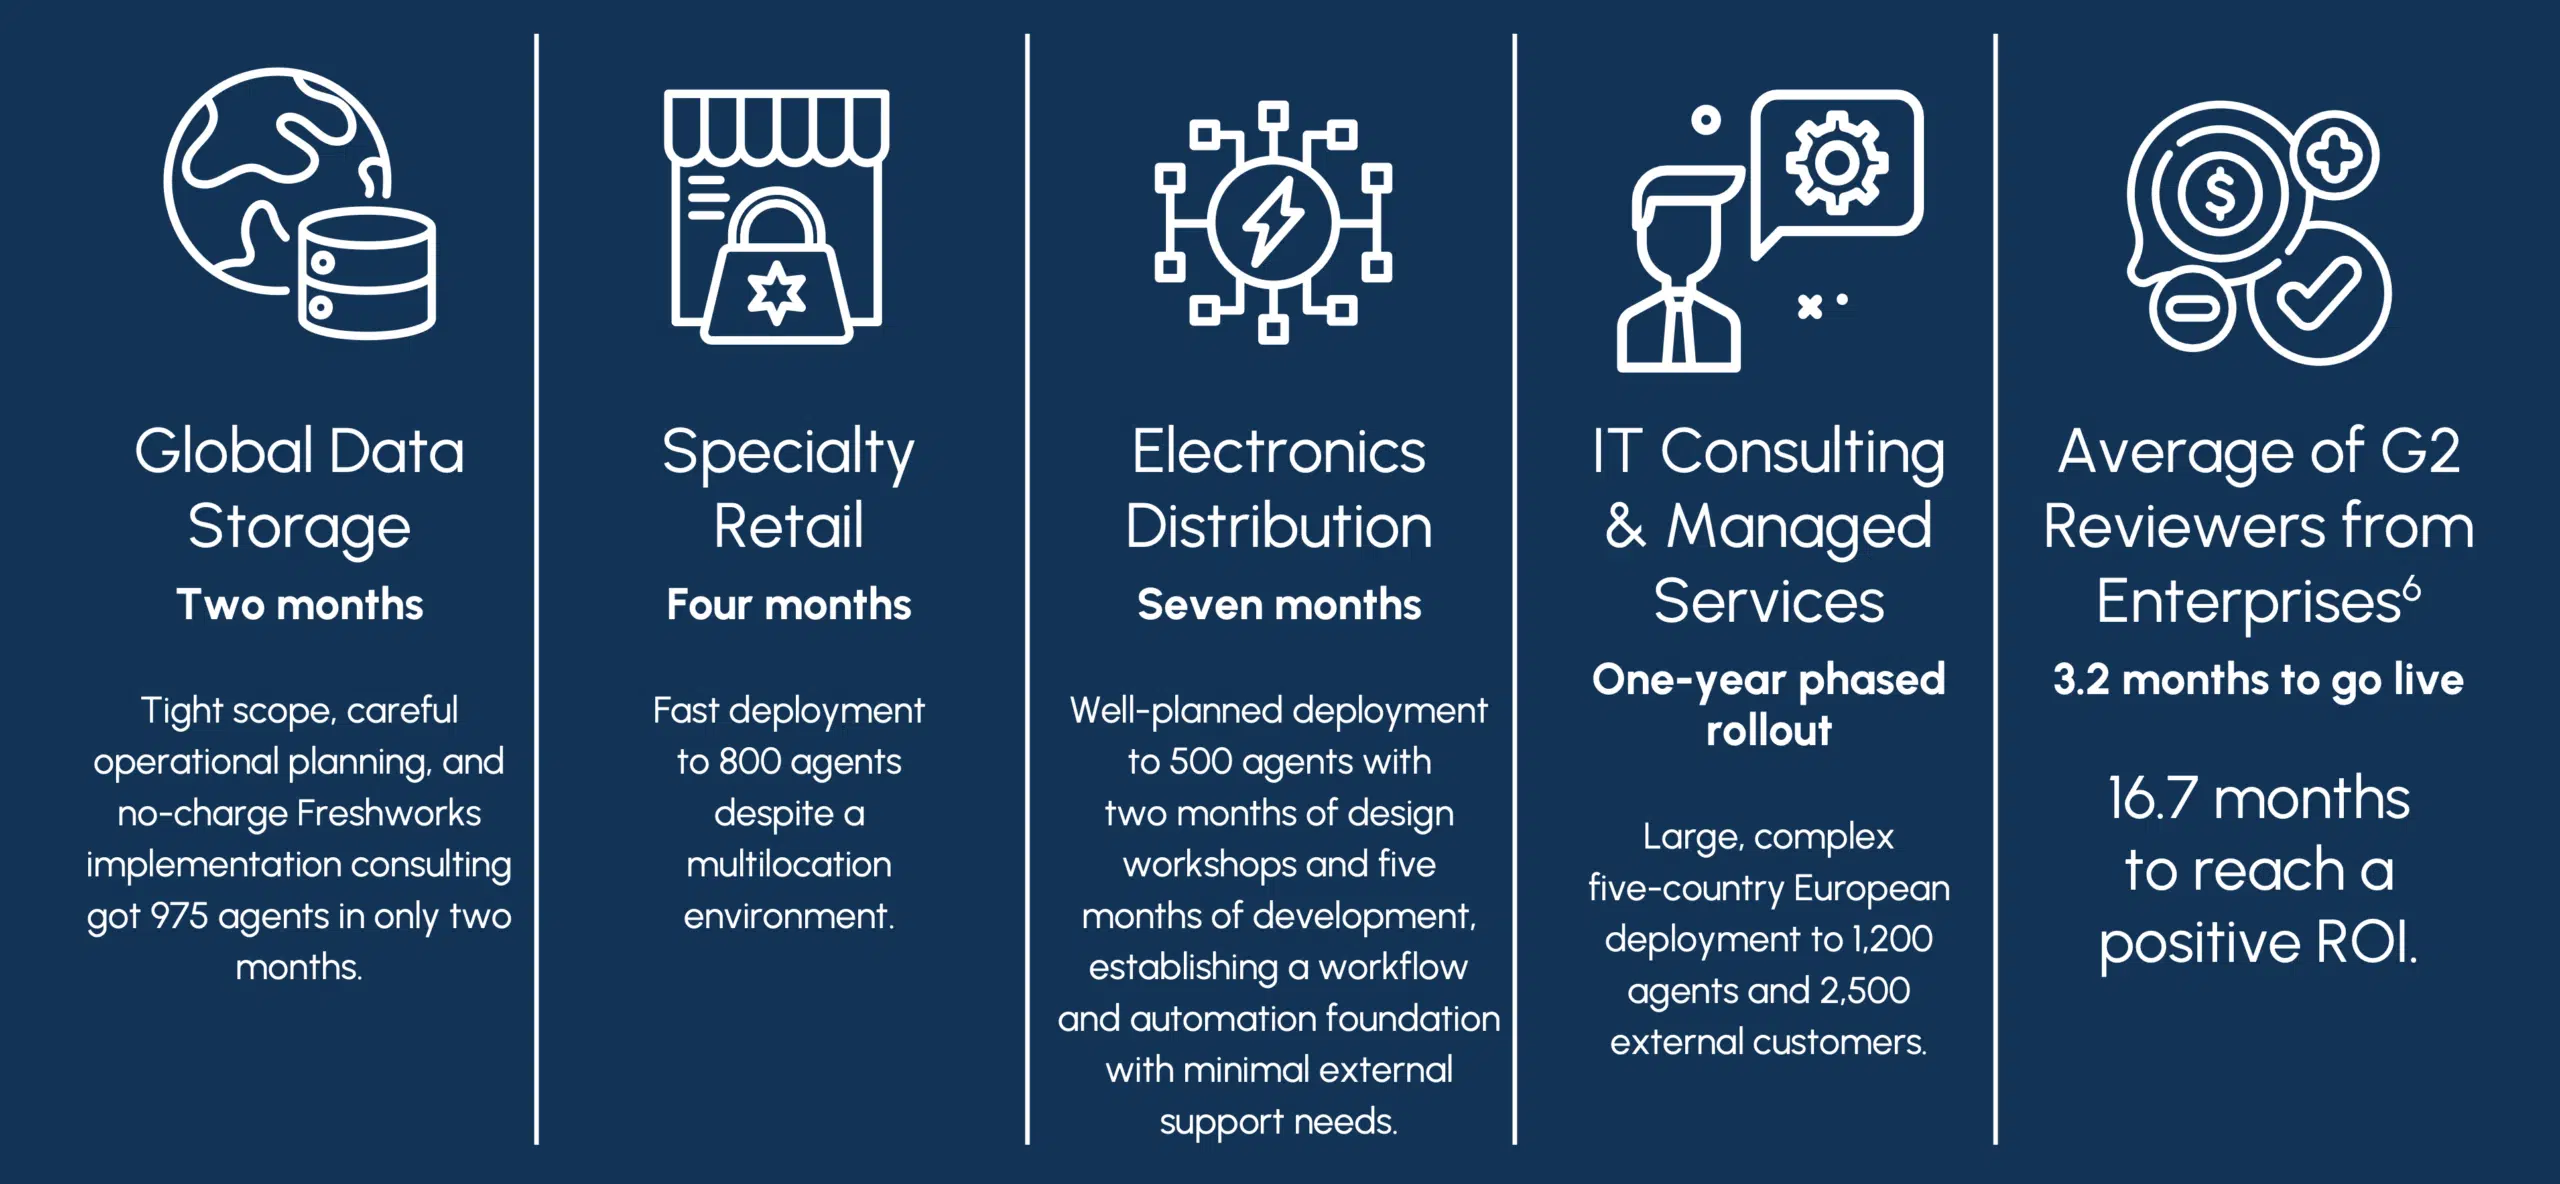
6 Source: G2 review data from April 27, 2023 through April 27, 2026 from global enterprise customers of Freshservice (N=51 reviewers for time to go live, N=32 reviewers for time to positive ROI).
"Freshservice provided… the guardrails to develop and customize just enough without breaking production. It has never happened since we brought it online."
– Desktop Services Director, Electronics Distribution Organization
The following sections outline the key business value drivers and investment categories identified across the four organizations by migrating from large legacy ITSM platforms to Freshservice. Each include: the mechanism by which value was generated, the composite assumptions used in the financial model, the observed range reported by interviewees, and a ‘What This Means for You’ note explaining how results may vary across organizational contexts.
Freshservice’s all-inclusive licensing model, which covers AI, analytics, CMDB, and the full ITSM module suite under a single per-seat price, eliminated the pattern of incremental add-on costs that had driven prior platform expenses upward year over year. This direct software licensing cost reduction was the most immediate and consistent financial benefit.
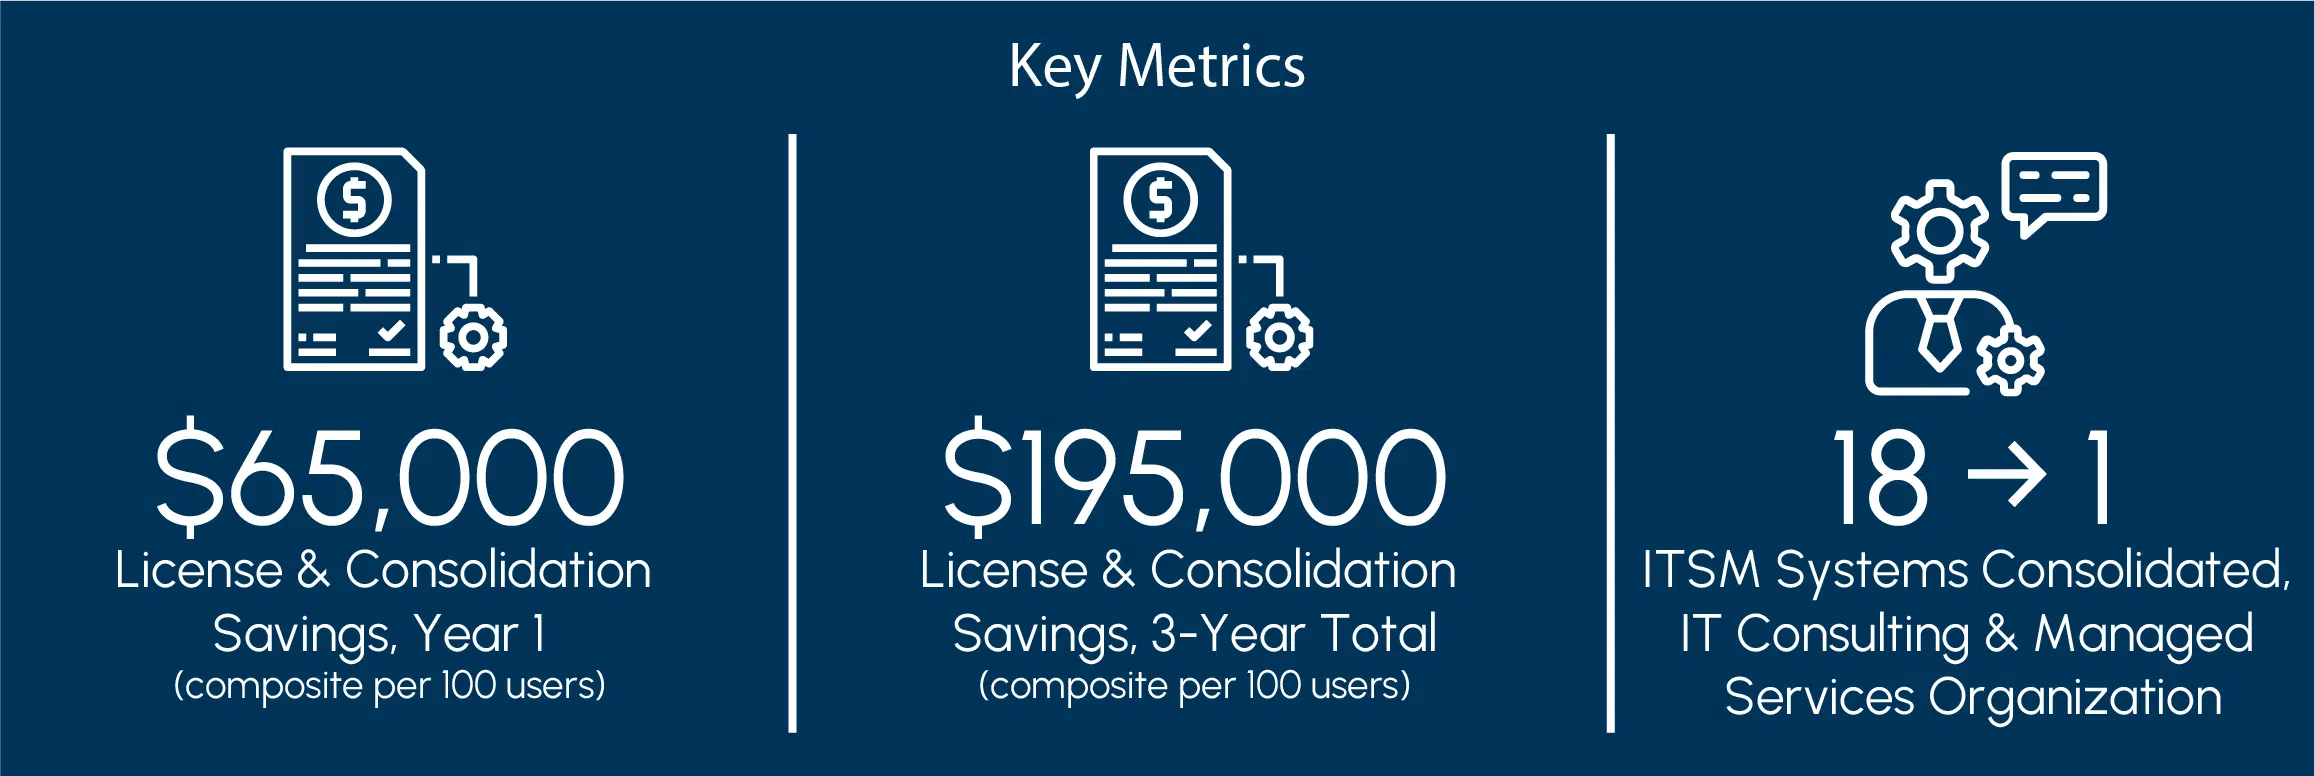
The Global Data Storage Organization illustrates both cost-reduction and consolidation benefits. The organization reduced its annual ITSM licensing spend by $300,000, moving from a quoted legacy platform renewal of $800,000 to $500,000 with Freshservice, while increasing its licensed seat count from 900 to 975. It simultaneously consolidated roughly a dozen standalone tools, including analytics, AI, reporting, and SOX compliance platforms, into Freshservice’s unified suite. This saved an additional estimated $90,000 per year by eliminating integration overhead, vendor management complexity, and duplicate administrative effort.
Other organizations showed similar patterns:
"Freshservice wasn't every discrete thing with a different sticker price. You could opt in for all aspects of ITSM, AI, analytics, everything, basically under one umbrella."
–Senior Director, IT Infrastructure, Global Data Storage Organization
When evaluating the business case for Freshworks at your own organization, consider the following:
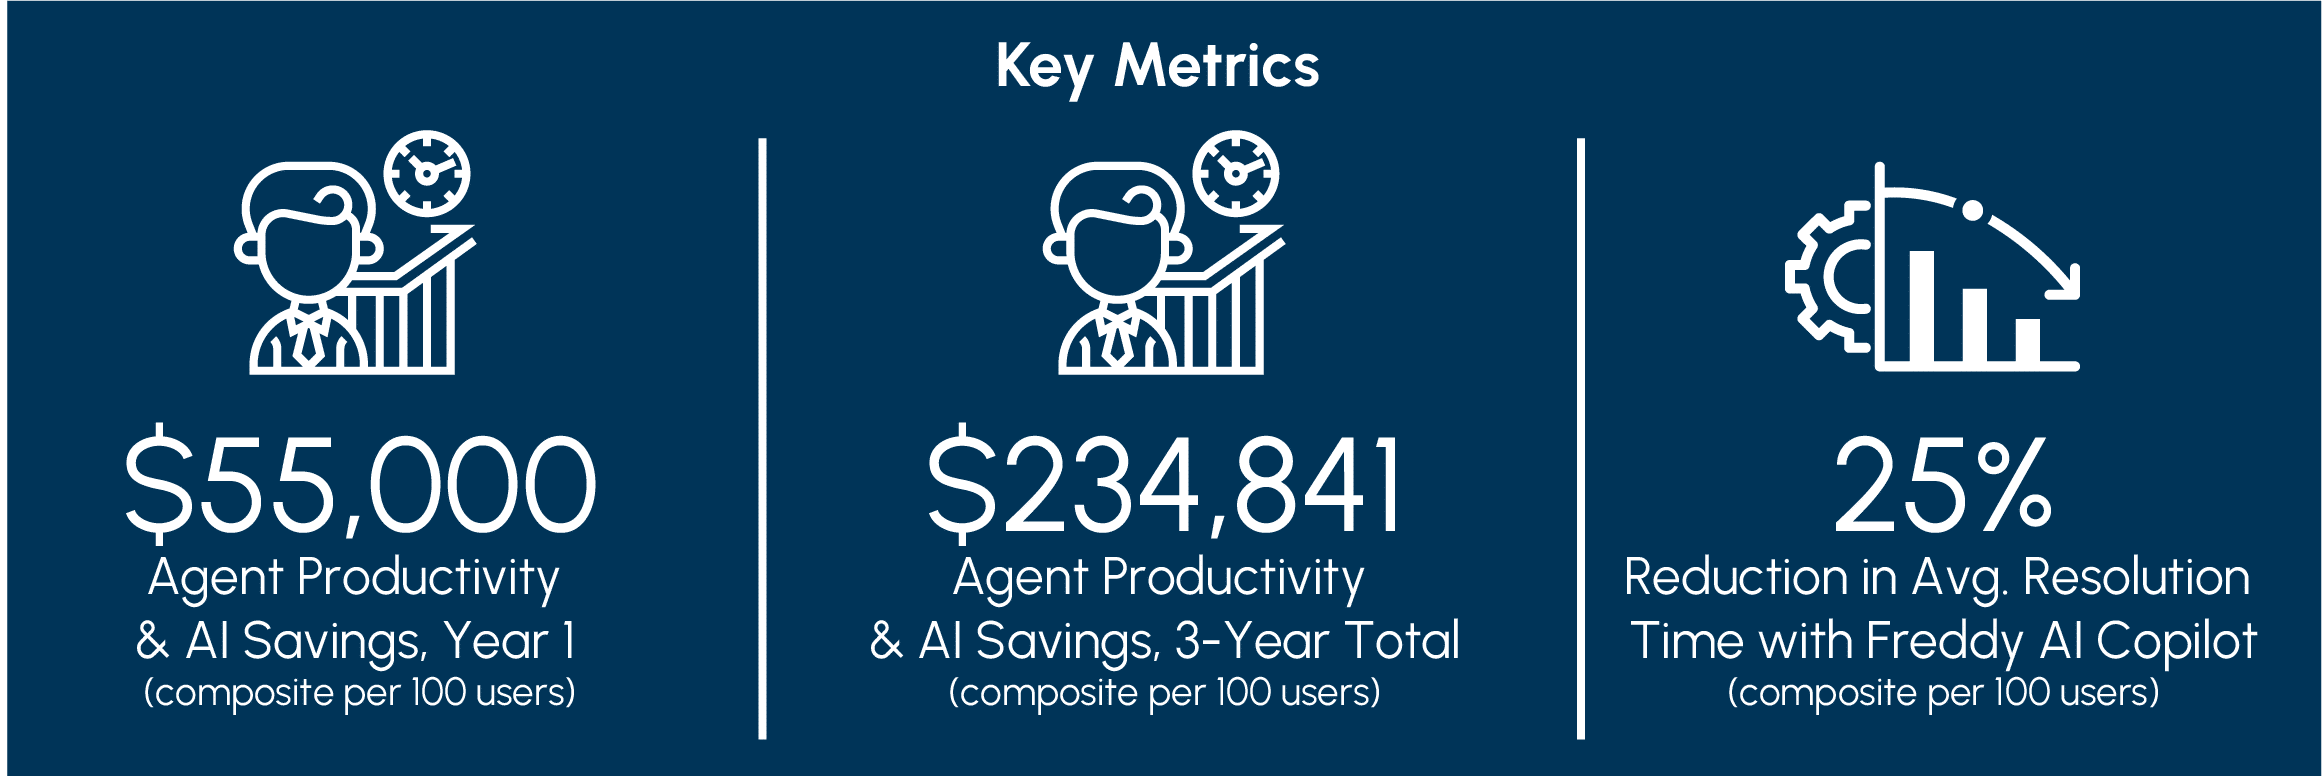
Freshservice’s Freddy AI Copilot, streamlined workflow execution, and real-time ticket traceability delivered measurable productivity improvements for service desk agents across all four organizations, with gains increasing as AI adoption matured. These productivity improvements directly increased the enterprises’ ability to service customers and drive growth without major headcount increases:
Across all four organizations, ticket traceability and activity-level visibility emerged as consistent, non-AI drivers of productivity. Freshservice’s granular activity logging removed operational ambiguity associated with misrouted or lost tickets, reducing the time agents and managers previously spent tracking and reconciling ticket status.
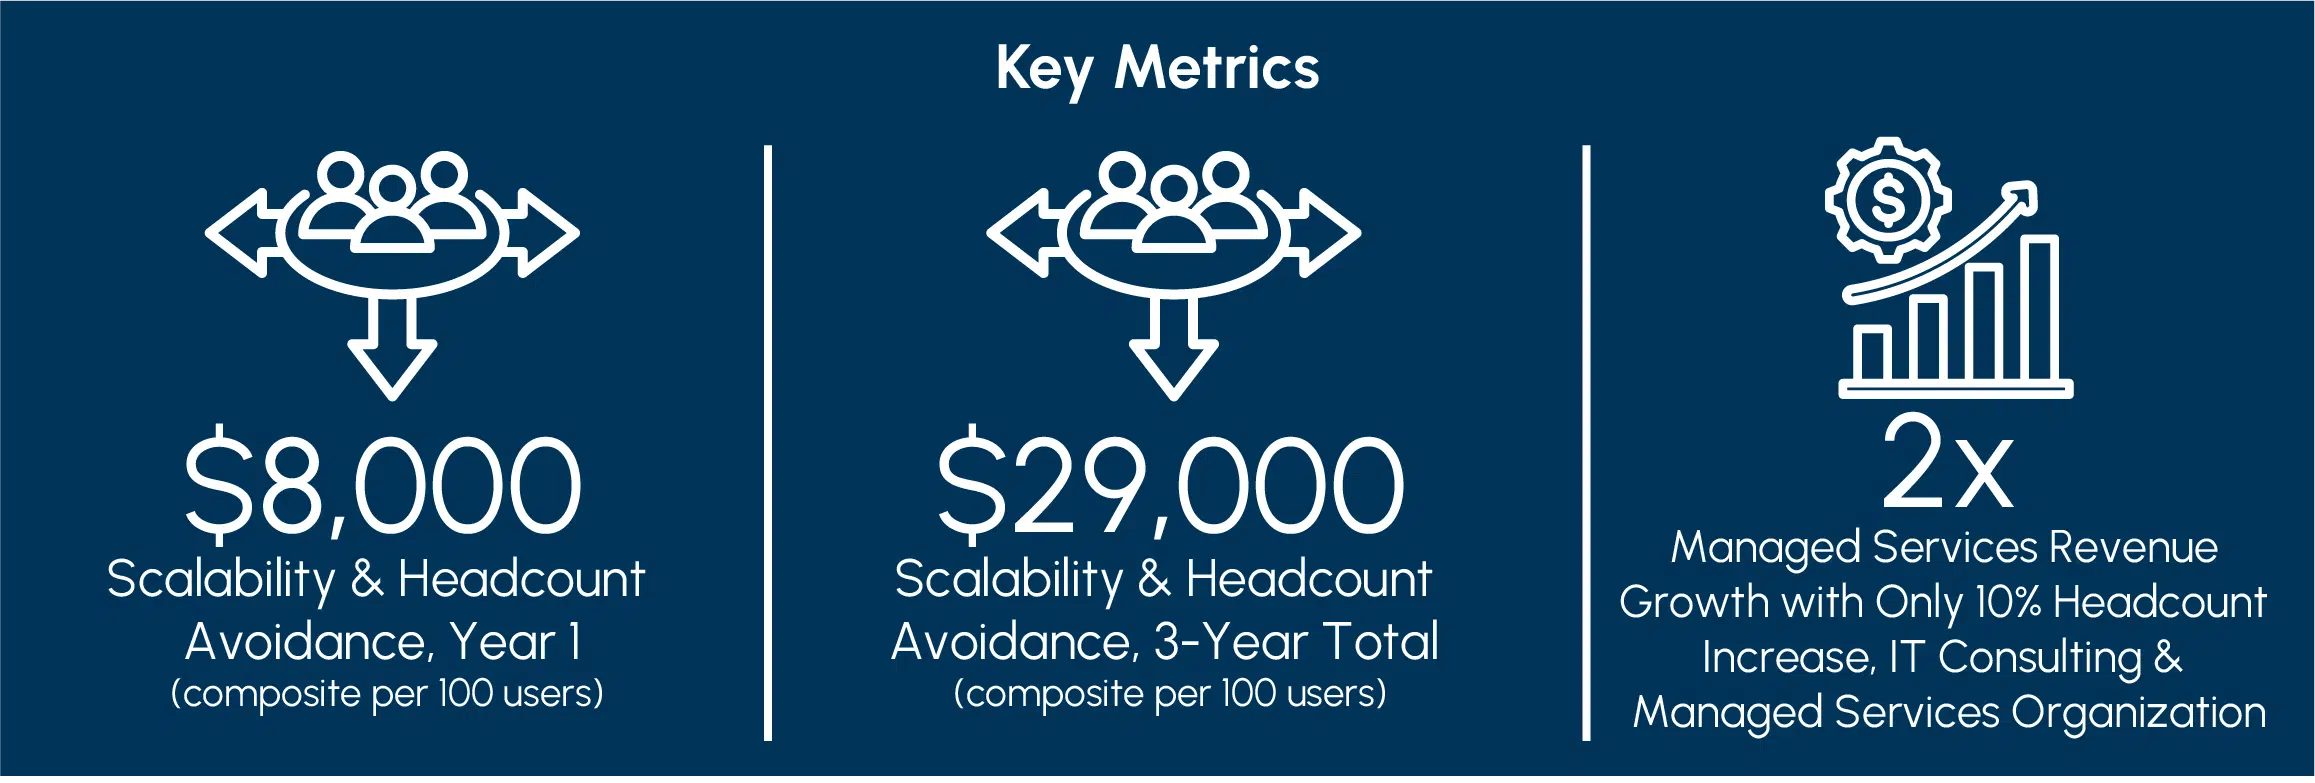
"From 2024 to 2025, we did 50% more tickets with roughly the same number of FTEs. We doubled our managed services revenue but only grew headcount by 10%."
–Chief of Staff, IT Consulting & Managed Services Organization
When evaluating the business case for Freshworks at your own organization, consider the following:
Freshworks’ AI capabilities extend well beyond automating routine responses. They fundamentally reshape how IT organizations deliver value to employees and manage service workloads at scale. The Freshservice platform embeds Freddy AI across two complementary delivery modes: Freddy AI Copilot, which augments agent workflows by accelerating resolution and reducing handle time, and Freddy AI Agent, which resolves employee requests autonomously without requiring live agent involvement. Together, these capabilities produce compounding returns across both operational efficiency and end- user experience.
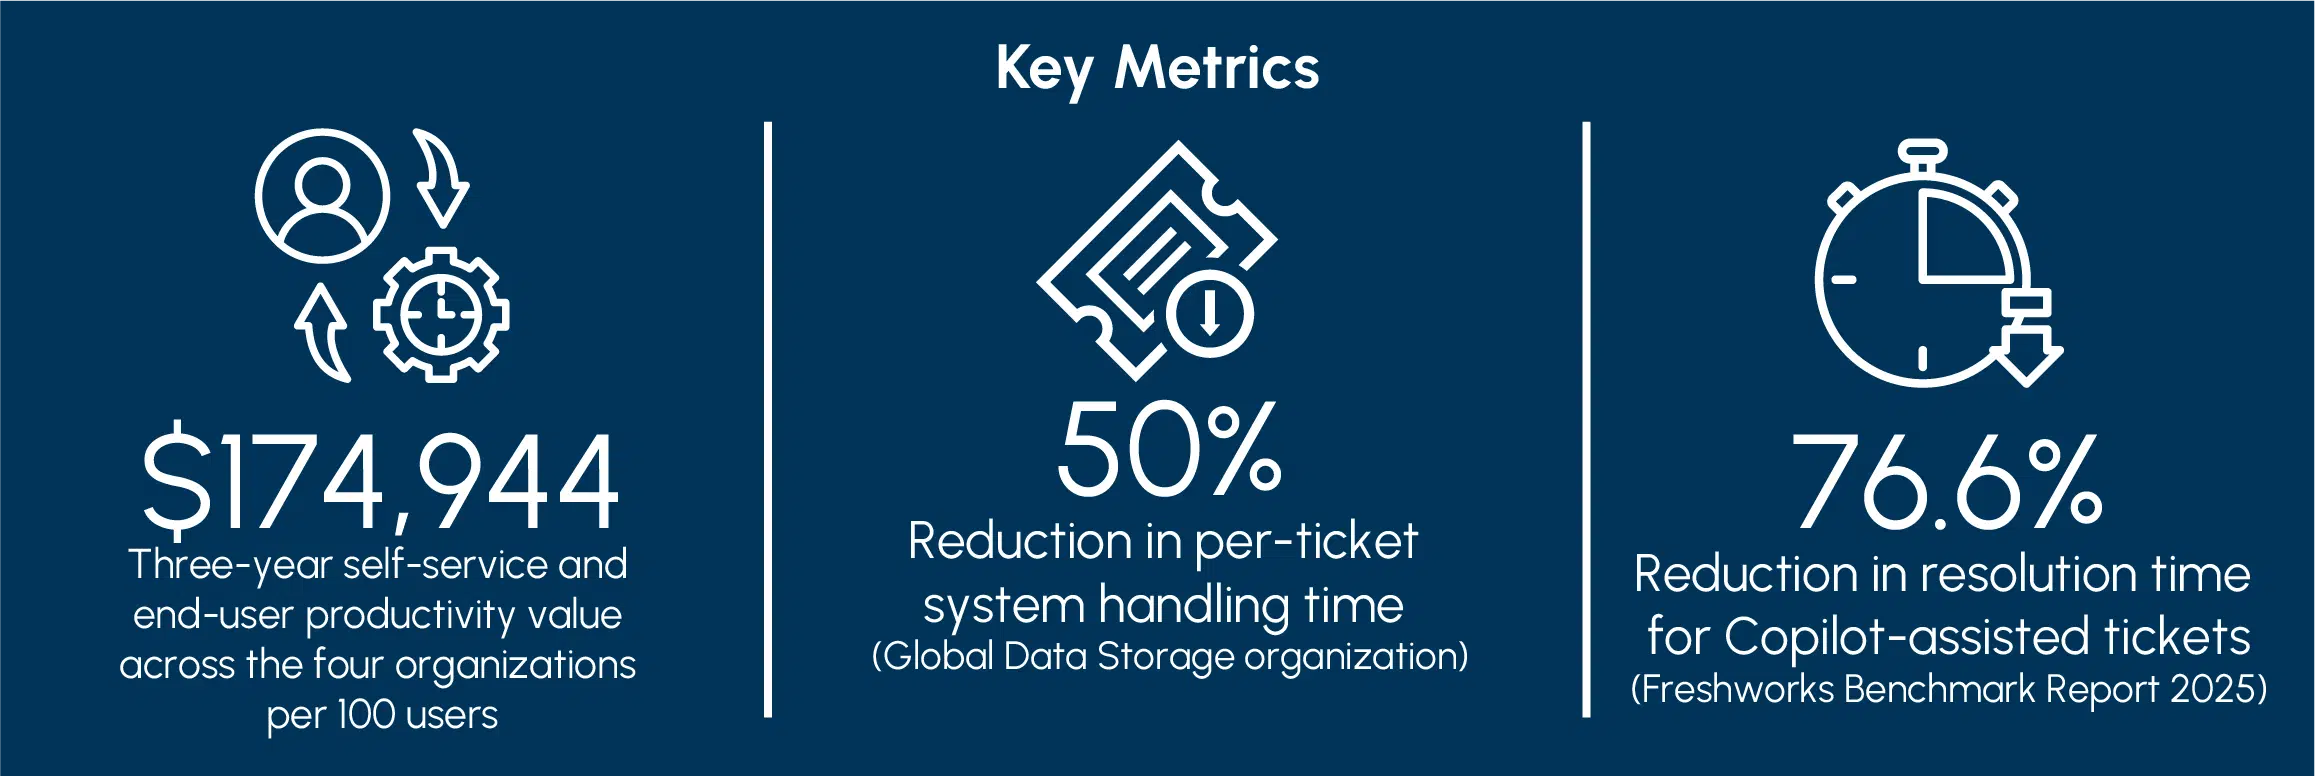
Across the four organizations in this study, Freshworks-enabled self-service and AI-assisted productivity contributed $174,944 per 100 users in quantified three-year value, reflecting improvements in resolution speed, reduced end-user wait time, and a lower total cost per service interaction. Two of the four organizations had active Freddy AI deployments contributing directly to self-service outcomes; the remaining two realized productivity gains through platform-enabled workflow improvements and end-user experience enhancements. One participating organization, a global data storage company, confirmed a 50% reduction in per-ticket system handling time, cutting agent system time from five minutes to 2.5 minutes per ticket across more than 280,000 tickets annually. A second organization in specialty retail scaled Freddy AI Copilot adoption from 140 to 400 agents over the study period, while its autonomous self-service capabilities remain in an earlier ramp-up phase.
To place these outcomes in a broader context, Freshworks’ Benchmark Report 2025 documents a 76.6% reduction in resolution time for Copilot-assisted tickets compared to manually handled tickets across active deployments. The productivity gains observed in this study are consistent with what the platform delivers at scale, and the organizations here represent different points on the maturity curve. As each advances its Freshservice AI configuration, the operational and workforce productivity outcomes are structured to increase over time.
The impact on end-user productivity extended across all four organizations: real-time notifications, lifecycle transparency, and mobile-optimized ticket management reduced the disruption caused by IT incidents regardless of whether AI self-service was fully active. Employees no longer had to wait in phone or chat queues for an initial response. Instead, the self-service portal and AI capabilities provided immediate acknowledgment and, in many cases, immediate resolution. The Electronics Distribution Organization highlighted mobile ticket management as a particularly high-value capability for its facilities team, whose members work away from desks: “Everything that the facilities team does is on their phone. They can just pick up a ticket, close the ticket, update the ticket, all really fast.”
At scale, the cumulative effect of faster resolution and shorter wait times returns substantial hours to the broader workforce, one of the largest benefit categories in the composite model.
7 McKinsey & Company, The State of AI: Global Survey 2024.
"Users don't wait in queues anymore. Theycan ask their question and get an immediate response from the bot. That's where the big wins are coming from, and why users are so pleased."
–Senior Director, IT Infrastructure, Global Data Storage Organization
When evaluating the business case for Freshworks at your own organization, consider the following:
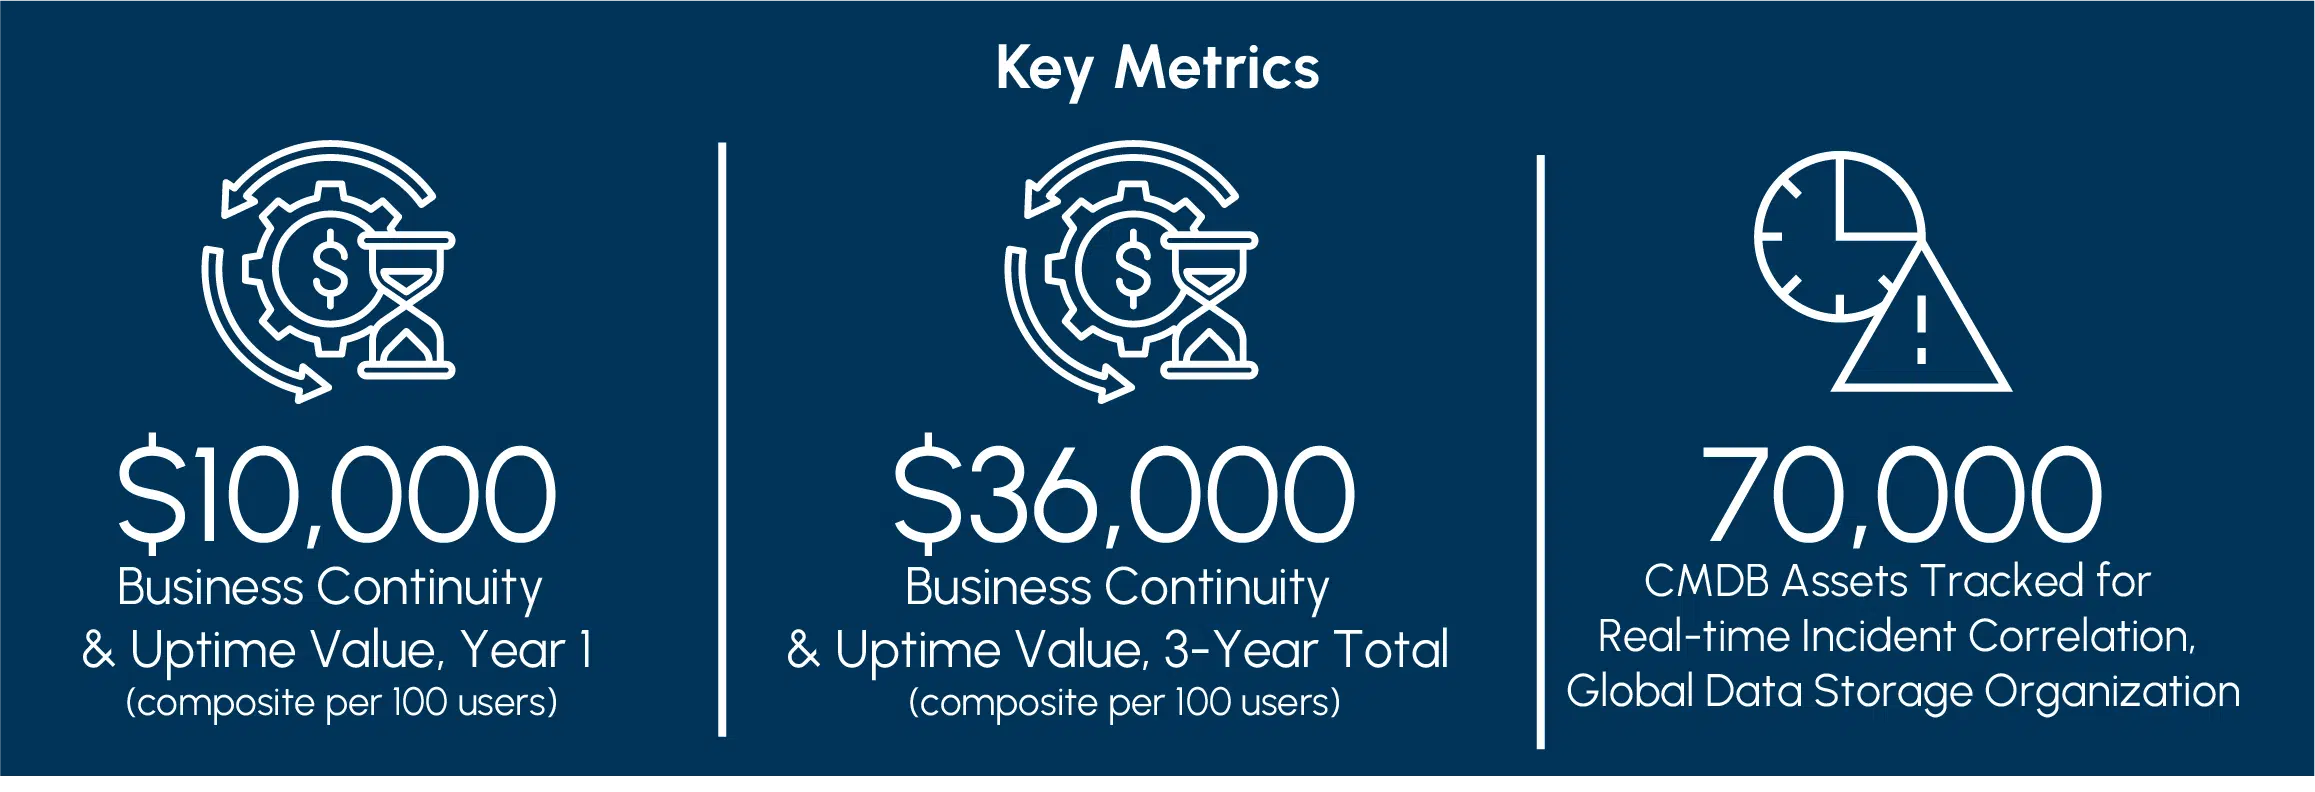
Freshservice’s major incident management, CMDB integration, and problem management capabilities reduced financial risk from unplanned downtime for critical infrastructure at scale. The value of major incident management stems from cumulative improvements, including faster response times, fewer repeat incidents, and reduced mean time to resolution for high-priority issues:
"Freshservice was a fresh start, a quantum leap forward in modernizing our processes. Having a single source of truth for all information, with its interrelated parts, is the biggest win."
–Senior Director, IT Infrastructure, Global Data Storage Organization
Business continuity value is inherently organization-specific, and this study’s financial valuation is conservative by design.
Freshworks empowered all interviewed enterprises to automate high-volume service operations, increasing throughput without proportional increases in headcount or operating costs. Rather than adding agents to handle rising ticket volumes or an expanded platform scope, organizations used automation, intelligent routing, and self-service to extend capacity. Operational efficiency absorbed increased demand, letting the organizations defer planned headcount additions.
"What was going to take us into the future and set us up for growth the next 10–15 years? That was the real key. We saw Freshservice as a disruptor in this space."
–Desktop Services Director, Electronics Distribution Organization
Headcount avoidance is most credible when supported by documented staffing plans or open requisitions, both of which were present in the organizations studied. Organizations with rapidly growing ticket volumes, especially those expanding into HR, Finance, or Facilities, are more likely to realize this benefit as automation absorbs incremental demand. The IT Consulting & Managed Services Organization illustrates this dynamic, with a 50% year-over-year increase in ticket volume absorbed without proportional headcount growth, reflecting improved operational capacity as automation matured. This benefit is particularly relevant in constrained labor markets, where hiring timelines are extended.
Freshservice provided qualitative benefits consistently for interviewees that sit outside the quantified model: better service delivery, AI capability maturity, compliance and risk reduction, shift to higher value work, and improved employee experience. Interviewees consistently reported these outcomes, but as the connection to direct financial impacts could not be proven, they are not included in the quantified financial model and its ROI, NPV, or payback calculations. This study also omits any potential additional benefits that organizations with different before states (not a large legacy platform) or different use cases and needs might experience, as those are outside the scope of this data collection.
The IT Consulting & Managed Services Organization reported an increase in NPS from approximately 30 to over 51 after deployment, reflecting more consistent, transparent ITSM processes. These internal changes produced measurable service outcomes, including higher SLA performance, faster response times, and reduced reliance on informal escalation channels.
"Our NPS moved from around 30 to over 51 since we deployed Freshservice. That's a reflection of everything improving together, the processes, the visibility, the responsiveness."
–Chief of Staff, IT Consulting & Managed Services Organization
Organizations that deploy Freddy AI for defined use cases build the groundwork for capabilities that extend beyond immediate ROI. They develop governance, knowledge management, and change management practices over time that enable broader adoption of AI-enabled service operations. For example, the Global Data Storage Organization described its deployment as an ongoing progression, expanding from initial AI use in IT to active deployment across HR and Finance, supported by a self-service portal serving 27,000 employees.
Freshservice strengthened compliance and risk management capabilities. For example, the Global Data Storage Organization implemented SOX-compliant workflows within Finance, supported by structured approvals, documented change control, and complete audit trails capabilities that were difficult to achieve in prior fragmented environments. Across organizations, structured change management reduced the risk of undocumented or untraceable system changes, improving operational stability and audit readiness. For example, the Electronics Distribution Organization reported that its frequent production incidents in the prior environment ceased after migrating to Freshservice.
Interviewees described a reduction in low-value operational work and increased focus on more complex service activities. Structured workflows, automated routing, and AI-assisted resolution reduced time spent on manual ticket handling, status tracking, and switching between disconnected systems. Agents could focus more on complex issues requiring judgment, technical expertise, and stakeholder interaction.
Employees shifting from manual, repetitive tasks to more complex service work reported cleaner workflows, faster feedback loops, and reduced operational friction, contributing to improved day-to-day working experience.
Freshworks’ initial deployment costs include implementation and professional services, internal labor for configuration and workflow development, training and change management, API and integration work, CMDB build-out, and data migration from legacy platforms.
The normalized deployment cost was $49,430 per 100 users, but costs varied widely across organizations from $5,128 per 100 users (Global Data Storage with included implementation support) to $146,500 per 100 users (IT Consulting & Managed Services Organization, which required a phased rollout across five countries and more than 15,000 hours of internal labor). G2 data mirrors this analysis exactly: the average onetime costs for deploying Freshservice were $49,500 normalized per 100 users for the 22 enterprise reviewers on G2 that provided cost data.8
Costs were driven primarily by integration complexity and internal labor rather than licensing. Organizations that leveraged Freshworks’ implementation resources achieved lower costs and faster time-to-value, whereas those requiring third-party consulting, custom integrations, or multi-country standardization incurred higher upfront investment.
8 Source: Futurum weighted normalization of N=22 global enterprise reviewers on G2 from April 27, 2023 through April 27, 2026 that are customers of Freshservice.
Deployment and servicing costs are the most controllable variables in the BEV equation, but unlike licensing’s predictable cost scaling with usage, service-related costs vary with scope, integration requirements, and organizational complexity.
Organizations that define scope tightly, negotiate implementation support in the licensing deal, and use Freshworks’ bundled onboarding resources will deploy at a fraction of the composite average. Year 0 infrastructure integration connectors, workflow templates, and CMDB configuration carry high reuse value. The marginal cost of extending Freshservice to another business function in Year 2 or 3 is substantially lower than the initial investment, so per-function cost drops with each expansion.
Annual operating costs include platform licensing, administration, and ongoing configuration and optimization. These costs were generally stable year over year for study participants, with only modest increases in some cases driven by user growth or expanded platform usage.
The normalized annual operating cost was approximately $76,280 per 100 users for Years 1 through 3, including about $57,000 for licensing and $19,280 for administration. Futurum omitted G2 review data from the financial analysis to high variability without the ability to deeply examine and verify all costs, but notably, G2 reviewers indicate much lower costs may be achievable for some organizations.
The Global Data Storage Organization demonstrates the efficiency of the all-inclusive model. Despite expanding coverage to six departments and broadening the platform’s scope, annual costs remained stable because there were no incremental per-module or per-feature fees. However, premium support and consulting services can require additional costs, as experienced by the IT Consulting & Managed Services Organization.
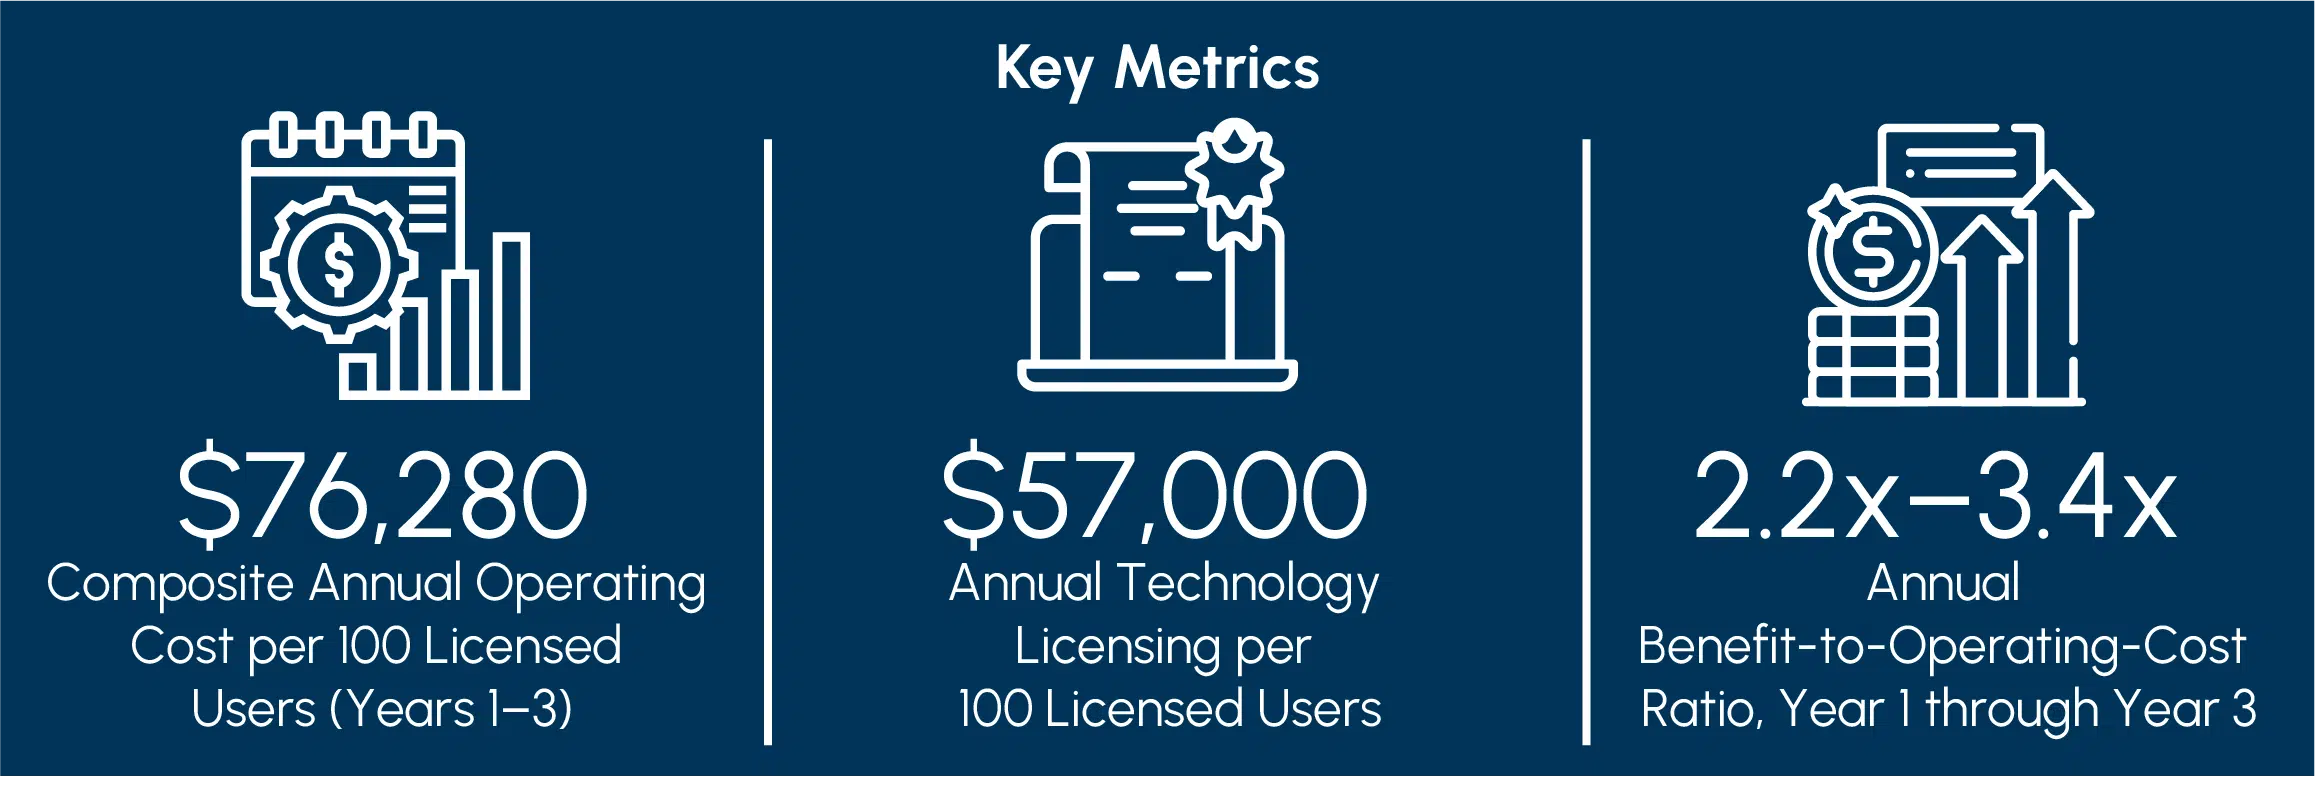
Annual operating costs should be evaluated in the context of scale, scope, and utilization. As deployments expand to non-IT departments, the platform’s value surface grows while its per-seat cost structure remains fixed, improving the benefit-to-cost ratio year over year. In this study, annual benefits exceeded annual operating costs by approximately 2.2x in Year 1, increasing to approximately 3.4x by Year 3 as the benefit curve accelerated while operating costs remained stable. Organizations that maintain governance discipline, ensure knowledge base hygiene, and execute planned AI capability expansions on schedule will realize the steepest improvement in this ratio over the modeling horizon.
The outcomes documented in this study reflect what disciplined, well-scoped Freshservice migrations from large legacy platforms delivered across diverse enterprise contexts.
Based on the results and recommendations from the customer interviews, Futurum recommends:
This financial analysis illustrates the potential financial impact of migrating to Freshworks’ Freshservice for enterprises that previously operated large, legacy ITSM platforms. All values are normalized to a per-100-licensed-users basis. Equal-weight composite average across four organizations. Numbers may not sum exactly due to rounding.
Figure 3. Three-Year Cash Flow — Composite BEV Model (Per 100 Licensed Users)
Source: Futurum Research composite financial model, per 100 licensed users.
Table 3. Composite BEV Results (Per 100 Users)
| Metric | Composite Result (Per 100 Users) |
|---|
Source: Futurum Research composite financial model.
Table 4. Composite BEV Results by Benefit Category (Per 100 Users)
| Benefit Category | Composite Model (3-Year, Per 100 Users) |
|---|
Source: Futurum Research composite financial model.
Freshworks sponsored this BEV study, which The Futurum Group conducted in accordance with its established methodology for quantifying the value of enterprise software and services. The financial outcomes presented reflect aggregate data from primary interview data collected by Futurum Research analysts in early 2026 with four enterprise organizations that deployed Freshservice between 2022 and 2025. All financial figures are research-based estimates and should not be construed as guarantees of future financial performance; they provide an illustrative view of the outcomes organizations may expect from migrating to Freshservice with appropriate planning, process investment, and ongoing AI activation discipline. Individual results will vary based on organization size, prior platform complexity, industry vertical, and deployment maturity.
Donald Jin, Research Director, Business Economic Value
Benjamin Brown, VP of Custom Research
Futurum Research
Contact us if you would like to discuss this report and The Futurum Group will respond promptly.
This paper can be cited by accredited press and analysts, but must be cited in context, displaying author’s name, author’s title, and “The Futurum Group.” Non-press and non-analysts must receive prior written permission by The Futurum Group for any citations.
This document, including any supporting materials, is owned by The Futurum Group. This publication may not be reproduced, distributed, or shared in any form without the prior written permission of The Futurum Group
The Futurum Group provides research, analysis, advising, and consulting to many high-tech companies, including those mentioned in this paper. No employees at the firm hold any equity positions with any companies cited in this document. This Competitive Assessment report was commissioned by Oracle.
The Futurum Group is an independent research, analysis, and advisory firm, focused on digital innovation and market-disrupting technologies and trends. Every day, our analysts, researchers, and advisors help business leaders from around the world anticipate tectonic shifts in their industries and leverage disruptive innovation to either gain or maintain a competitive advantage in their markets.
The Futurum Group LLC
futurumgroup.com
(833) 722-5337
The vision behind everything in Futurum’s Custom Research practice is this: research should show you what is happening, what comes next, and what to do about it. It should be personal to each audience, easy for people to grasp, and structured so LLMs can reason over it accurately. And it should be fast and turnkey; you want answers now, not another project to carry for quarters.
Whether you are defining business, channel, or go-to-market strategy; evaluating vendors or justifying ROI; or commissioning research to fill an emerging market need, we have your back, with a program that answers your questions with the objectivity and credibility to drive real decisions.
To do it, we bring unmatched data to bear: Futurum research, surveys, and market projections; validated market feeds; ETR’s 15 years of insight from 10,000 technology decision-makers; G2’s buyer and user data; and what our analysts hear every day. Add leading primary collection, from AI-moderated voice interviews to surveys and analyst-led interviews, all turnkey, and every project comes out credible, nuanced, and actionable.
And we don’t just drop the results in your lap. For internal work, we provide analyst-led sessions, interactive dashboards, and a range of formats. For market-facing work, Futurum delivers turnkey activation and amplification that actually gets seen, by people and by LLMs, through our media and share of voice. This is research that moves decisions and markets.
We will meet you wherever you are, from a fast-turn brief to a multi-year program, and shape the work to your goals, timeline, and budget. The right program for your moment.
If any of this is useful, I would love to talk.

VP, Custom Research · The Futurum Group
Get important insights straight to your inbox, receive first looks at eBooks, exclusive event invitations, custom content, and more. We promise not to spam you or sell your name to anyone. You can always unsubscribe at any time.

