
Disclosure: This report was commissioned by Microsoft and conducted independently by The Futurum Group.
Price pressures in the PC market have reached levels not seen in years, mostly driven by AI-fueled memory shortages and increases in component costs. Many ecosystem partners project significant declines in demand, but Futurum’s data tells a different story.
Futurum’s study of 462 consumer PC buyers across North America, Europe, and Asia-Pacific finds that consumer demand is far more durable than the fear narrative suggests. Only 8% of buyers would leave the PC market entirely, even under the most extreme price scenarios tested. The remaining 92% remain addressable: adjusting specs, timing, or channel rather than exiting the market permanently. PCs are infrastructure. That distinction changes the math on demand forecasting entirely.
The organizational signal corroborates the consumer finding. In a separate Futurum survey of 838 enterprise IT decision-makers conducted across North America, EMEA, and Asia-Pacific, 50% planned to increase PC spending in the next 12 months, and AI PC budgets were expected to grow by approximately 20% in 2026 versus 2025. Organizational buyers are not retreating from the category.
Buyers remain addressable. Even at the most extreme price scenario tested, only 8% would leave the PC market permanently. The remaining 92% adapt: adjusting specs, timing, or channel.
Permanent market exiters. Across every scenario tested, just 8% said they would not buy a PC under any circumstances. These are not price-sensitive deferrers. They are structurally out of the market.
Platform loyal buyers. Price pressure reshapes purchasing behavior within ecosystems, not across them. Windows buyers spec down, delay, or buy refurbished — within Windows.
Absorb and proceed. At modest price increases, the vast majority of buyers proceed without significant disruption. PCs are essential infrastructure for work and education.
Futurum conducted a double-blinded primary research study in March 2026 of 462 adult consumers planning to purchase a PC in the next 12 months. The research included approximately 115 hours of voice interview transcripts (893,000 words) conducted by a scripted AI moderator at an average of 15 minutes per interview.
The concern among PC ecosystem partners is rational. Cost pressures have arrived and they are shaping the PC ecosystem pricing.
AI infrastructure build-outs have been consuming high-bandwidth memory at a pace that has diverted manufacturing capacity away from the DRAM (dynamic random-access memory) and NAND (flash storage memory) used in consumer PCs. Memory costs have surged as a result, with the price impact already moving through the supply chain into the channel. Several PC manufacturers have announced price increases in late 2025 and at the start of 2026 (NotebookCheck, December 2025). These are not just projections, as we can already observe price increases in the market.
What makes this cycle different from prior memory corrections is the source of demand pressure. Data center operators building out AI infrastructure are competing for the same fabrication capacity that produces consumer DRAM. The shortage is a structural reallocation of capacity toward higher-margin AI memory products, and it is expected to persist through at least the first half of 2026.
Given this backdrop, supply chain planners and channel partners have modeled potential demand declines of up to 20% to 30%, based on an assumption of near-perfect price elasticity. If prices go up 30%, many project that demand could fall 30%. The organizational buyer data challenges that projection. In a separate Futurum survey of 838 enterprise IT decision-makers, 61% said they are prepared to adjust PC purchasing budgets upward in response to tariffs. Organizational buyers are absorbing, not abandoning.
Without direct consumer data, that assumption seems understandable. With consumer data, it does not hold up. The 462 consumer buyers in this study provided a consistent, meaningfully different perspective from what these models assume.
Futurum walked consumers planning to buy a PC this year through hypothetical scenarios to determine what they would do if faced with potential cost increases beyond current pricing. Futurum evaluated what they would do at 10%, 20%, and 30% price increases above March 2026 levels, such as: proceeding with purchases, delaying, reducing specifications, changing brands or platforms, using financing, or exiting the market entirely. Furthermore, Futurum evaluated the drivers behind these decisions and the differences between consumer audiences to unpack what it means for PC ecosystem businesses if their fears of price increases come to fruition.
Out of the surveyed consumers, 8% said they would never buy a PC again. These are not price-sensitive buyers who might return. They are structurally out of the market: retirees, light-use consumers, and fixed-income buyers whose needs a tablet or smartphone can fully serve. That 8% is permanent.
The remaining 30% who walk away from a specific purchase at a specific price are a different group entirely. They are making a timing decision, not a market exit decision. Most would re-enter when prices drop, when a sales event occurs, or when their current device fails and necessity overrides price sensitivity. They are deferred revenue, not lost revenue.
This is the distinction the fear narrative conflates. At 30% above budget, 38% of buyers walk away from that specific purchase (see Figure 1). Partners may see 38% and model a permanent demand loss, but the data says something different: the addressable market only contracts by 8% permanently. The remaining 92% can be recovered through pricing strategy, promotional timing, and channel mix. Even under sustained 30% price increases over March 2026 levels, true demand loss is far smaller than the headline exit numbers suggest.
Figure 1. Behavioral Response at Three Price Thresholds
Source: Futurum Research, PC Buyers Survey, March 2026.
The reason is structural: buyers treat PCs as infrastructure, not discretionary purchases.
Across the 462 buyers surveyed, 72% cited work or professional productivity as their primary reason for needing a PC. Another 16% identified education. Only 4% said they could genuinely manage without a PC (see Figure 2). When asked directly whether a phone or tablet could substitute if their computer stopped working, the overwhelming majority said no.
Figure 2. PC Essentiality by Primary Use Case
Source: Futurum Research, PC Buyers Survey, March 2026.
"It is 100% essential. I need the laptop to do work meetings, Zoom calls, and to transfer documents between myself and my employees. I would not be able to get by with just phone and tablet."
– Buyer, North America
"I do most of my work activity on my laptop, so it is quite critical. If my computer or laptop stopped working tomorrow, I would be on standstill. I would immediately need a new one."
– Buyer, EU
Buyers who said they could manage without a PC were almost exclusively retirees and light users; the same population that accounts for the 8% permanent exiters. For working professionals and students, the purchase question is not ‘whether’. It is when, at what price, and configured how.
Behavior shifts on a graduated curve, with price increases of 20% mark as the critical inflection point. This distinction matters more for inventory and promotional planning than headline exit numbers.
The budget tier of a PC is one of the strongest predictors of a consumer’s behavioral response to price increases (see Figure 3).
Figure 3. Purchase Intent Retention by Budget Tier
Source: Futurum Research, PC Buyers Survey, March 2026.
A total of 88% of buyers planning a purchase intend to stay with their current operating system. Price pressure reshapes purchasing behavior within ecosystems, not across them. Windows buyers who feel price pressure will spec down, delay, or buy refurbished hardware within Windows PCs. They are not migrating to macOS or Chromebook.
Respondents bring further clarity to the data. The qualitative record is unambiguous. A European respondent said: “Since I am very familiar with Windows when it comes to work, that is also easier for me. I also have cloud storage with OneDrive, with Microsoft. Apps are available for pretty much all devices.” An APAC buyer said: “I have never been a fan of Mac or Apple. I have all my life used Windows. I like the way that technology operates. I am comfortable with it.”
Cross-platform defection is marginal; price pressure drives tier-switching and timing shifts within ecosystems. At 10% and 20% price increases, both Mac and Windows buyers behave identically: each platform retains 95% to 96% of buyers at 10% price increases, and retains 90% of buyers at 20% price increases, respectively. At the extreme 30% price increase scenario, Mac exit reaches 36% versus Windows at 39% – only a 3-point gap driven by Mac buyers’ greater familiarity with premium pricing (see Figure 4).
Figure 4. Platform Loyalty by Budget Tier
Source: Futurum Research, PC Buyers Survey, March 2026.
When buyers reduce specifications to stay within budget, they follow a consistent hierarchy. Storage is the first sacrifice, cited by 45% of those who would spec down. Screen size follows at 32%. Graphics capabilities, AI features, and aesthetics fill the middle. Processor speed and RAM are at the bottom, named by just 5% as the first thing to cut.
The reasoning is practical. Storage reductions are offset by cloud storage and external drives, an inexpensive workaround buyers are comfortable with. Screen size trade-offs (15 inches to 13 inches) are uncomfortable but livable. Processor and RAM compromises are seen as undermining the PC’s core function. Buyers do not think in silicon brand terms; they think in performance tier terms. Among those who would consider a processor step-down, 69% describe it as right-sizing to their actual workload, and 23% describe it as choosing a prior-generation flagship over a current-generation mid-tier chip, preserving performance while reducing cost.
"I would make sacrifices in the storage because I could always get an extra storage drive."
– Buyer, North America
"I would go for smaller screen size. And other options to see if I can lower closer to 1,500."
– Buyer, North America
The hierarchy is consistent across all three surveyed regions at its extremes. Storage goes first and processor goes last in all three regions. The one meaningful regional variation: in Europe, GPU sacrifice (29%) outranks screen reduction (26%), though the difference is narrow enough that the core hierarchy holds across all three regions (see Figure 5).
Figure 5. Spec-Down Hierarchy: Feature Sacrifice Rate by Region
Source: Futurum Research, PC Buyers Survey, March 2026.
Purchase delay is the most frequently stated response to elevated prices; out of the 462 buyers, 77% indicated they would postpone rather than overpay. But the delay window is bounded, and those bounds matter for inventory and promotional planning.
"I would probably wait another month or two. If the price drops, I would buy then. But if it does not drop and I need it for work, then I could accept it."
– Buyer, APAC
The most common delay tolerance is 3 to 6 months, with buyers timing their purchases around seasonal events: Black Friday, back-to-school, or end-of-financial-year sales. Buyers willing to wait 6 to 12 months are the next largest group. Very few would wait beyond 18 months (see Figure 6). Device failure is the universal delay-breaker. Once a current PC begins failing significantly, price sensitivity gives way to urgency.
Figure 6. Delay Tolerance Distribution
Source: Futurum Research, PC Buyers Survey, March 2026.
The 18% who would not delay are professionals whose work cannot wait. Professional necessity overrides price sensitivity. This group overlaps heavily with the price-insensitive buyer segment.
Adaptation rates are high across all three regions: 92% in Europe, 88% in North America, and 94% in APAC (see Figure 7). Exit rates vary: NA buyers exit at 12%, EU at 8%, and APAC at 6%. But in all three markets, the dominant story is the same: the overwhelming majority of buyers find a way to manage price increases without exiting the market. How they do it differs invways that matter for regional execution.
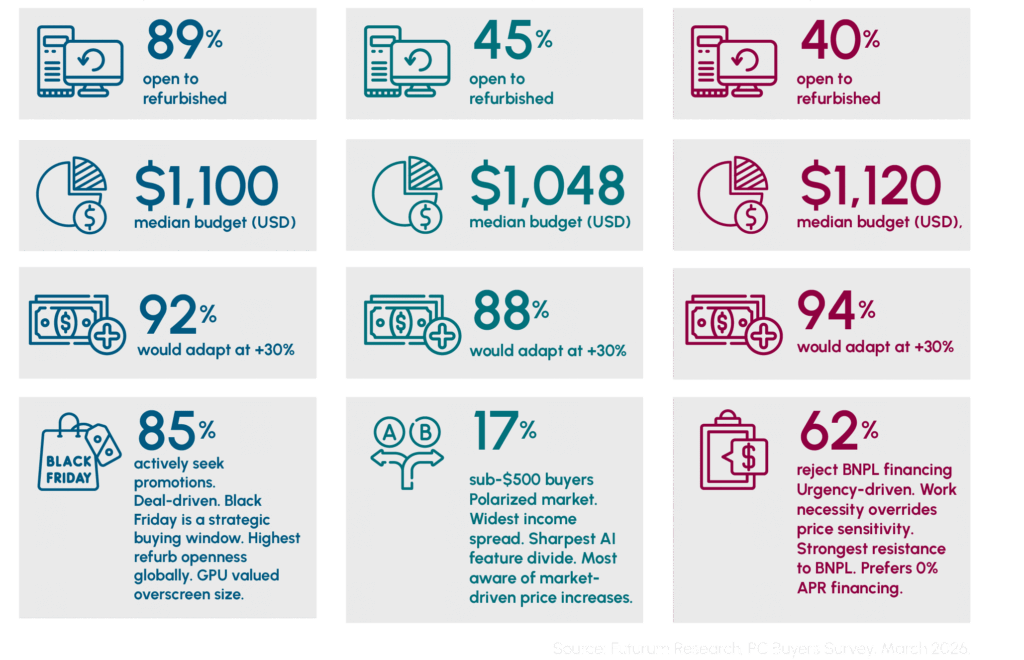
Regional budget medians are closer than the March 31 deck suggested. North American buyers set a median budget of $1,048, European buyers at $1,100 and APAC buyers at $1,120. All three regions converge around $1,100 (see Figure 8).
Figure 8. Budget Distribution by Region
Source: Futurum Research, PC Buyers Survey, March 2026.
The variation is in the tails. A small segment of high-budget professional buyers pulls APAC’s mean significantly above its median. Sub-$500 buyers exist in similar proportions across all three regions: 17% in NA, 16% in Europe, and 13% in APAC. The $1,000-plus segment is nearly identical: 56% in NA, 58% in Europe, and 56% in APAC. The mid-market is genuinely global. Regional differentiation in product and pricing strategy is a strategy for the tails, not the core.
Observed PC demand elasticity in this study is -0.5 to -0.7 of lost demand per percent of price increase, not the -1.0 that linear models assume. Based on these 462 buyer conversations, a 30% price increase does not produce a 30% volume decline. It produces roughly 8% permanent market contraction, plus a redistribution of the remaining demand across lower-ASP configurations, extended purchase timelines, and secondary market channels. Unit volumes face pressure. Revenue per unit faces more, but the buyers are there.
The organizational buyer data points in the same direction. In a separate Futurum survey of 838 enterprise IT decision-makers, 77% reported being more likely to purchase AI PCs than they had been six months prior. Windows 10’s end of support and the imperative to future-proof organizations for AI were cited by more than 90% of respondents as active accelerants of their refresh cycles – structural tailwinds that operate independently of tariff-driven price pressure and do not appear in supply-chain elasticity models.
A driver who will not pay $8 a gallon for gas does not sell the car. They carpool, combine trips, or wait out the price spike. Only the driver who decides they genuinely do not need a car has left the market. In the PC market, that person is 8%.
The data points toward three strategies PC ecosystem partners can employ to unlock a segment of the 92% addressable market that current pricing strategies are leaving on the table.
Buyers have described exactly what they will sacrifice and in what order: storage first, screen second, processor last. The data shows a clear product positioning opportunity: processor and RAM are the non-negotiable performance anchors that justify the purchase even at elevated prices. Storage and screen size are the configurable value levers, expendable to buyers but recoverable as upsell options at the point of purchase. Budget-tier products built around this hierarchy match how buyers naturally make trade-offs, rather than asking them to compromise on the dimensions they care most about.
A total of 80% of buyers said promotions would factor into their purchase timing. Black Friday and Cyber Monday were the single most cited demand window across all three regions, named by 65% of buyers. Back-to-school (25%), regional fiscal year-end sales (18%), and Prime Day equivalents (15%) cluster the rest (see Figure 9). These are not passive shopping windows. They are when price-sensitive and delay-driven buyers have already decided to buy, and the event is what triggers the transaction.
Figure 9. Promotional Events as Purchase Triggers
Source: Futurum Research, PC Buyers Survey, March 2026.
The anchoring effect compounds this. Multiple buyers who rejected a price at face value said they would accept the same price framed as a discount from a higher number. “$300 off a $1,500 laptop” converts better than “$1,200 base price” even when the net price is identical. Promotional framing is not just a timing tool – it changes how buyers perceive whether they are getting value.
Globally, 55% of buyers said they would consider certified refurbished hardware. In Europe, that figure reaches 89%, in North America it is 45%, and in APAC, 40%. These are not fringe numbers; they represent buyers who have been priced above their threshold for new hardware but have not left the market (see Figure 10).
Figure 10. Refurbished Hardware: Mainstream, Not Fringe
EU leads globally — nearly 2× other regions
Source: Futurum Research, PC Buyers Survey, March 2026.
The trust barrier is straightforward: hesitant buyers consistently cite warranty coverage and brand certification as decision factors. Manufacturer-authorized refurbished programs are not competing with motivated new-device buyers. They are retaining buyers who would otherwise extend their current device lifespan indefinitely or exit the near-term market entirely.
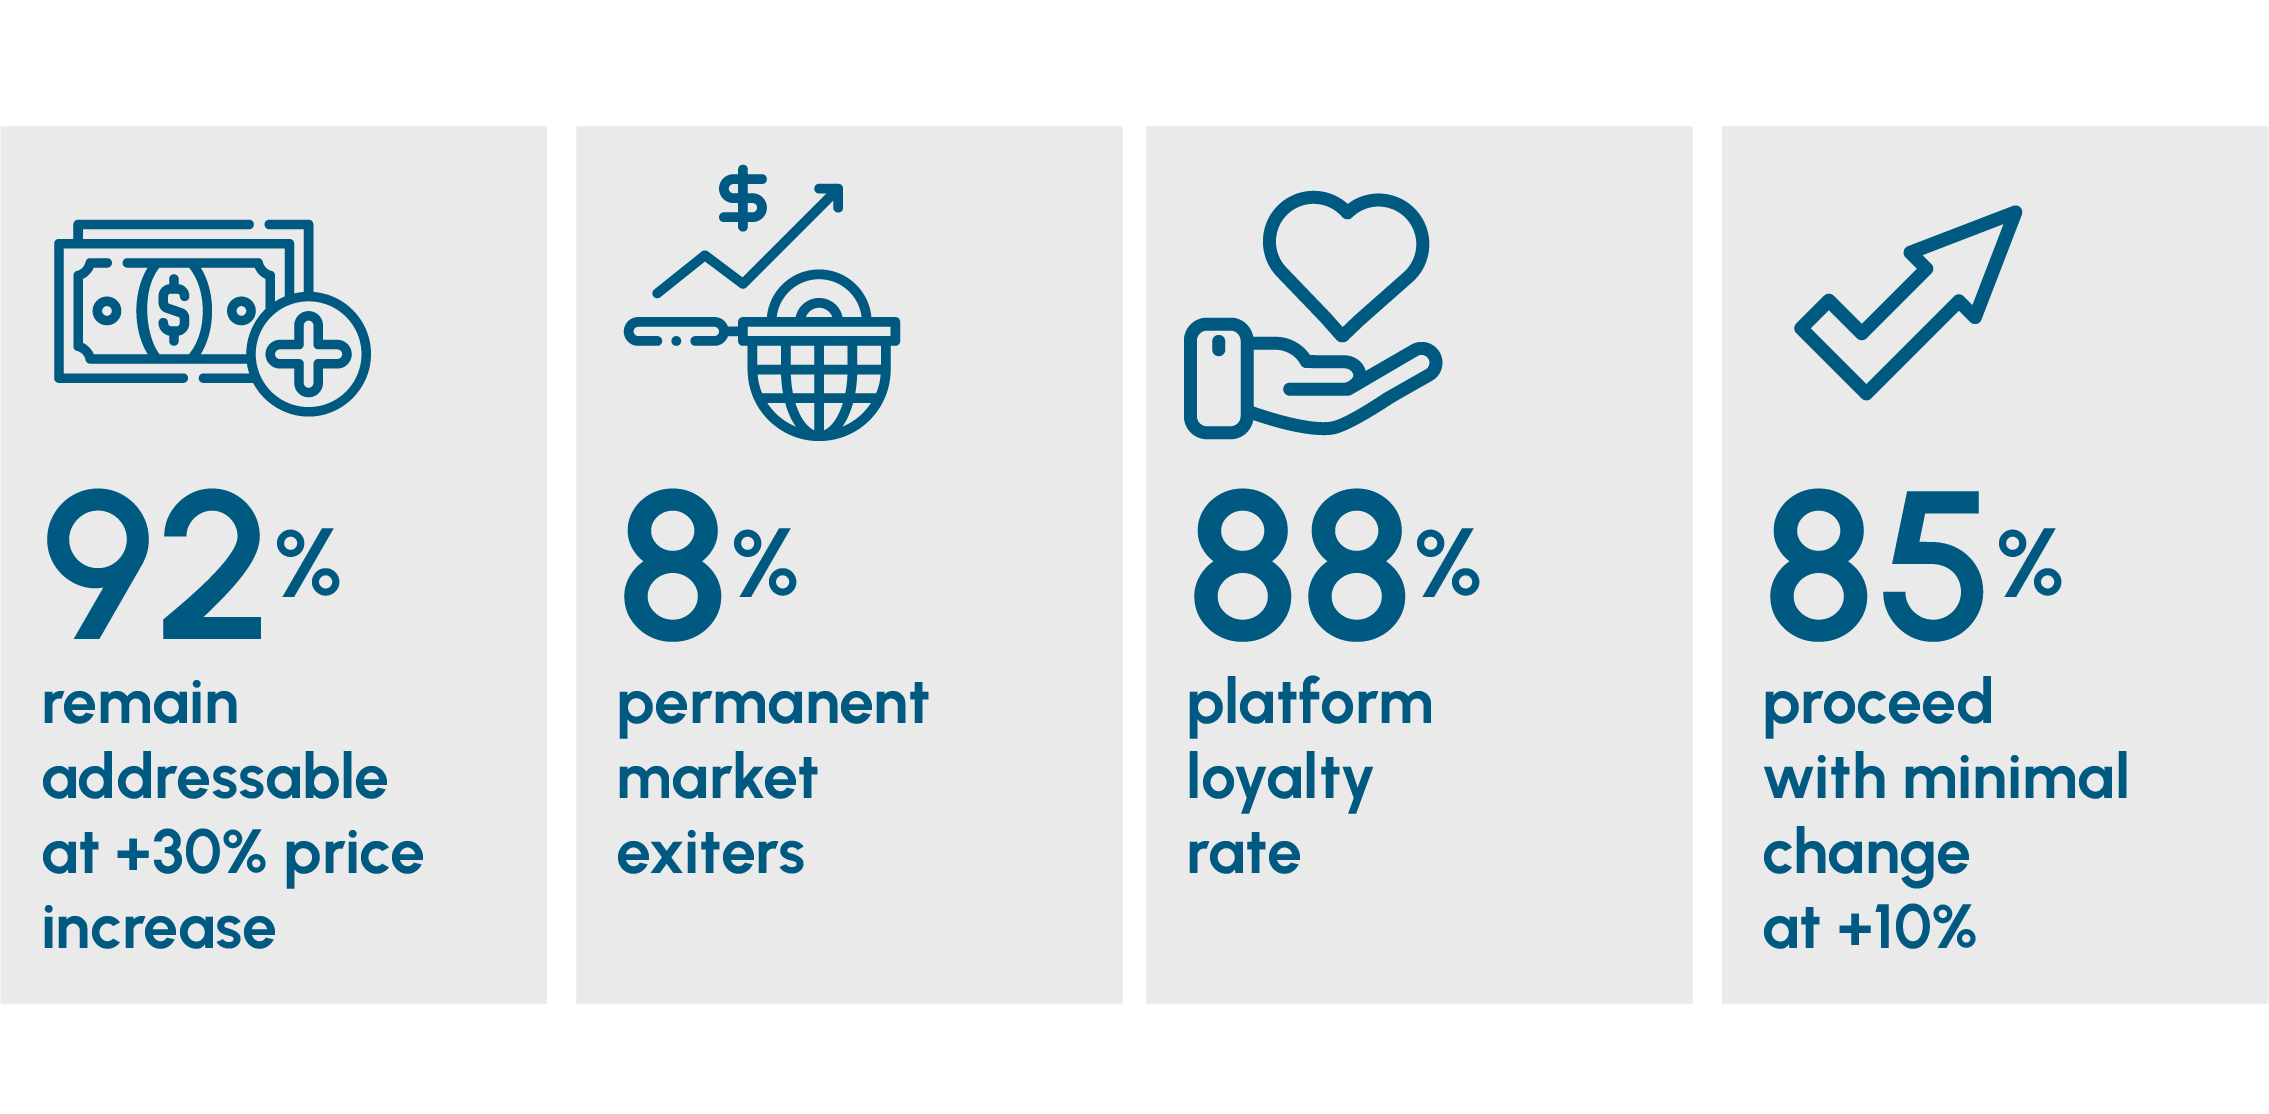
Figure 11 reframes the conversation. The addressable market is not collapsing under price pressure; it is reshaping. The 8% who exit are real, but they are structurally out of the category. The remaining 92% are not lost demand; they are conditional demand.
This distinction matters. What appears as demand destruction in traditional models is, in practice, a redistribution of how and when purchases occur: lower configurations, delayed timelines, and increased use of secondary channels. The underlying need does not disappear because the PC is not a discretionary product. For the vast majority of buyers, it remains essential infrastructure for work, education, and daily productivity.
The implication for the ecosystem is clear: growth will not be determined by whether demand exists, but by how effectively vendors align to how that demand adapts. Pricing strategy, product configuration, and channel design now sit at the center of conversion, not just margin optimization. Those who treat the market as shrinking will optimize for scarcity and miss opportunity. Those who recognize it as elastic, but recoverable, will capture it.
The gap between the 92% addressable market and realized demand is not a demand problem. It is an execution problem.
Chad Huston
Data & Forecasting, Futurum Research
Olivier Blanchard
Research Director & Practice Lead,
Intelligence Devices, The Futurum Group
Futurum Research
Contact us if you would like to discuss this report, and The Futurum Group will respond promptly.
This paper can be cited by accredited press and analysts, but must be cited in context, displaying author’s name, author’s title, and “The Futurum Group.” Non-press and non-analysts must receive prior written permission by The Futurum Group for any citations.
This document, including any supporting materials, is owned by The Futurum Group. This publication may not be reproduced, distributed, or shared in any form without the prior written permission of The Futurum Group
The Futurum Group provides research, analysis, advising, and consulting to many high-tech companies, including those mentioned in this paper. No employees at the firm hold any equity positions with any companies cited in this document. This Competitive Assessment report was commissioned by Oracle.
The Futurum Group is an independent research, analysis, and advisory firm, focused on digital innovation and market-disrupting technologies and trends. Every day, our analysts, researchers, and advisors help business leaders from around the world anticipate tectonic shifts in their industries and leverage disruptive innovation to either gain or maintain a competitive advantage in their markets.
The Futurum Group LLC
futurumgroup.com
(833) 722-5337
The vision behind everything in Futurum’s Custom Research practice is this: research should show you what is happening, what comes next, and what to do about it. It should be personal to each audience, easy for people to grasp, and structured so LLMs can reason over it accurately. And it should be fast and turnkey; you want answers now, not another project to carry for quarters.
Whether you are defining business, channel, or go-to-market strategy; evaluating vendors or justifying ROI; or commissioning research to fill an emerging market need, we have your back, with a program that answers your questions with the objectivity and credibility to drive real decisions.
To do it, we bring unmatched data to bear: Futurum research, surveys, and market projections; validated market feeds; ETR’s 15 years of insight from 10,000 technology decision-makers; G2’s buyer and user data; and what our analysts hear every day. Add leading primary collection, from AI-moderated voice interviews to surveys and analyst-led interviews, all turnkey, and every project comes out credible, nuanced, and actionable.
And we don’t just drop the results in your lap. For internal work, we provide analyst-led sessions, interactive dashboards, and a range of formats. For market-facing work, Futurum delivers turnkey activation and amplification that actually gets seen, by people and by LLMs, through our media and share of voice. This is research that moves decisions and markets.
We will meet you wherever you are, from a fast-turn brief to a multi-year program, and shape the work to your goals, timeline, and budget. The right program for your moment.
If any of this is useful, I would love to talk.

VP, Custom Research · The Futurum Group
Get important insights straight to your inbox, receive first looks at eBooks, exclusive event invitations, custom content, and more. We promise not to spam you or sell your name to anyone. You can always unsubscribe at any time.